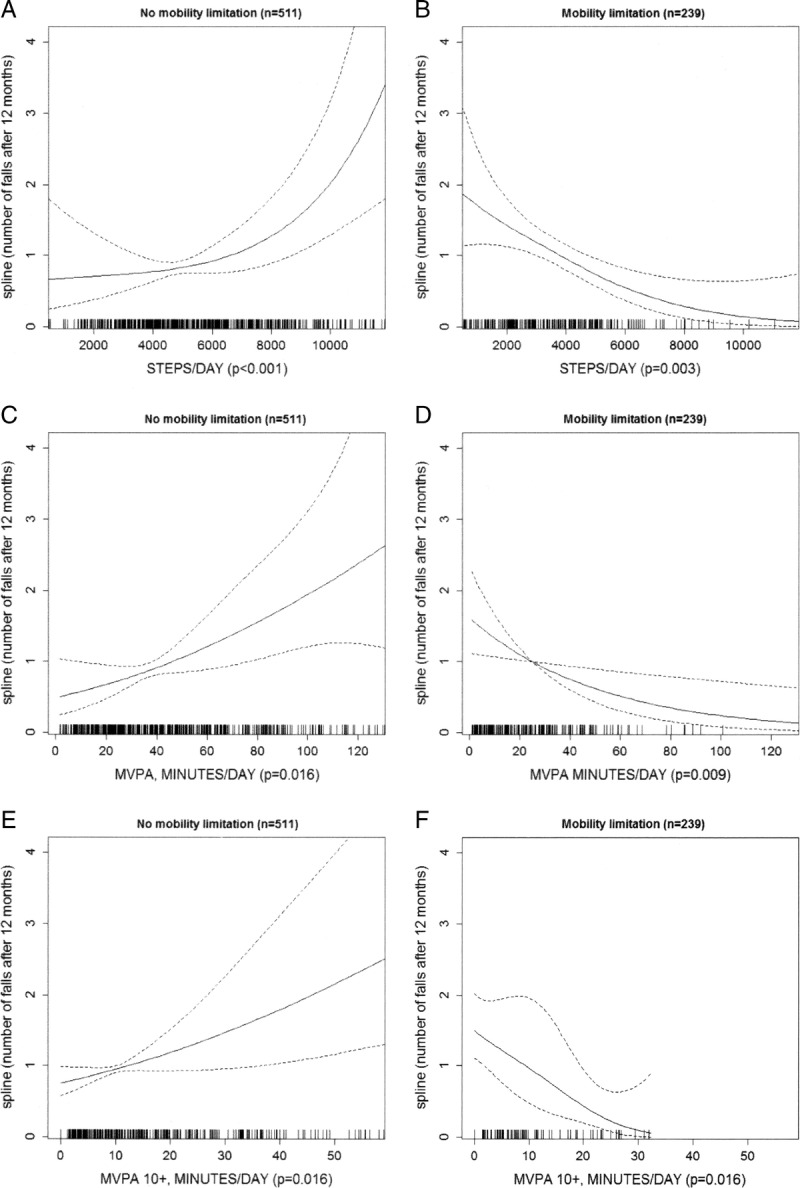
FIGURE 1.

Relationships between steps per day (panels A and B) and daily minutes of MVPA (accumulated in single minutes in panels C and D, and accumulated in bouts lasting 10 minutes or more in panels E and F) and number of falls, stratified by mobility limitations (no mobility limitations vs slight/moderate/severe mobility limitations). For each PA level, smoothed function from GAM, 95% CI (dotted lines), and P values are reported. Each model is adjusted for wear time, age, region, season, number of falls at baseline, living alone, BMI, number of chronic diseases, depression, vision problems, and use of medications.
