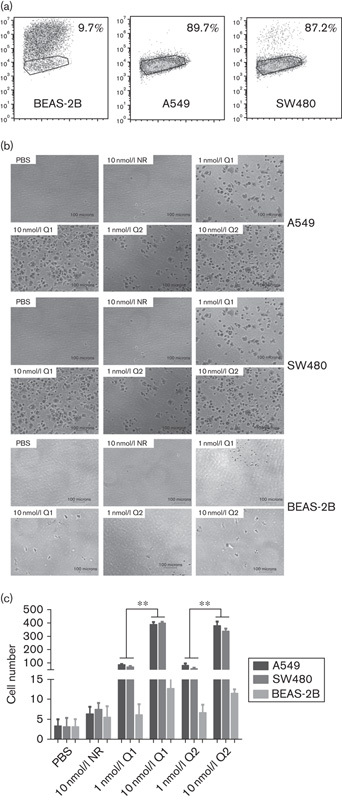
Fig. 2.

RGD-IFN-α2a-core fusion protein A549 and SW480 cancer cell surface-binding specificity analyzed in-vitro by the cell adhesion assay. (a) Flow cytometric analysis of αvβ3 integrin expression in different cell lines. (b) Cells were seeded into PBS-precoated, NR-precoated, Q1-precoated, or Q2-precoated 96-well plates and incubated for 1 h. After incubation, unbound cells were washed away with PBS and bound cells were fixed and stained with 0.5% crystal violet dye, viewed under an inverted microscope, and quantified. (c) Quantification of experiment B. The data are expressed as means±SEM from at least three independent experiments. **P<0.01 compared with the 0.1 nmol/l group. IFN, interferon; NR, nitrate reductase; RGD, arginine–glycine–aspartic acid.
