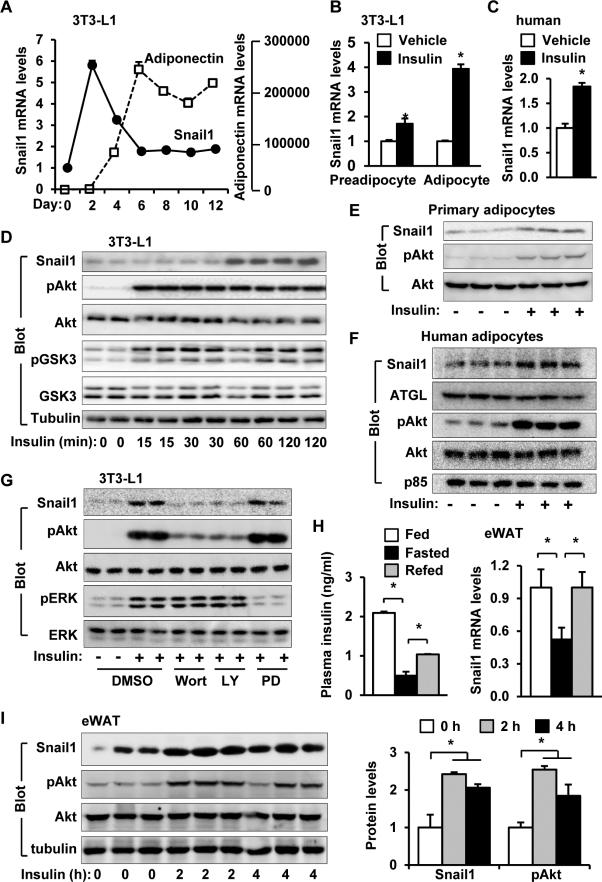
Figure 1. Insulin stimulates Snail1 expression in both mouse and human adipocytes.
A. 3T3-L1 preadipocytes differentiated into adipocytes. Snail1 and adiponectin mRNA levels were measured by qPCR and normalized to 36B4 expression. n=6. B. 3T3-L1 preadipocytes and adipocytes were treated with insulin (100 nM) for 48 h. Snail1 expression was measured by qPCR and normalized to 36B4 expression. n=4. C. Human adipose stem cells differentiated into adipocytes and stimulated with insulin (100 nM) for 5 h. Snail1 mRNA levels were measured by qPCR and normalized to GAPDH levels. n=3. D. 3T3-L1 adipocytes were stimulated with insulin (100 nM) for 0-120 min. Cell extracts were immunoblotted with antibodies against Snail1, phospho-Akt (pSer473), Akt, phospho-GSK3α/β (pSer21/9), GSK3α/β, or tubulin. E. Primary adipocytes were prepared from mouse eWAT and stimulated with 100 nM insulin for 2 h. Cell extracts were immunoblotted with the indicated antibodies. F. Human adipose stem cells differentiated into adipocytes and stimulated with insulin (100 nM) for 5 h. Cell extracts were immunoblotted with the indicated antibodies. G. 3T3-L1 adipocytes were pretreated with Wortmannin (100 nM), LY294002 (10 μM), or PD98059 (50 μM) for 30 min, and then stimulated with insulin (100 nM) for additional 2 h. Cell extracts were immunoblotted with the indicated antibodies. H. C57BL males (9 weeks) were randomly fed (n=7), fasted for 24 h (n=8), or refed for 3 h after 24 h of fasting (n=8). Plasma insulin levels and Snail1 mRNA levels in eWAT (normalized to 36B4 levels) were measured. I. C57BL males (12 weeks) were fasted overnight and treated with insulin (2 units/kg body weight, i.p.) for 2 h or 4 h. eWAT extracts were immunoblotted with the indicated antibodies, and Snail1 protein levels (normalized to tubulin levels) and Akt phosphorylation (normalized to total Akt levels) were quantified. The values are mean ± sem. *p<0.05.

