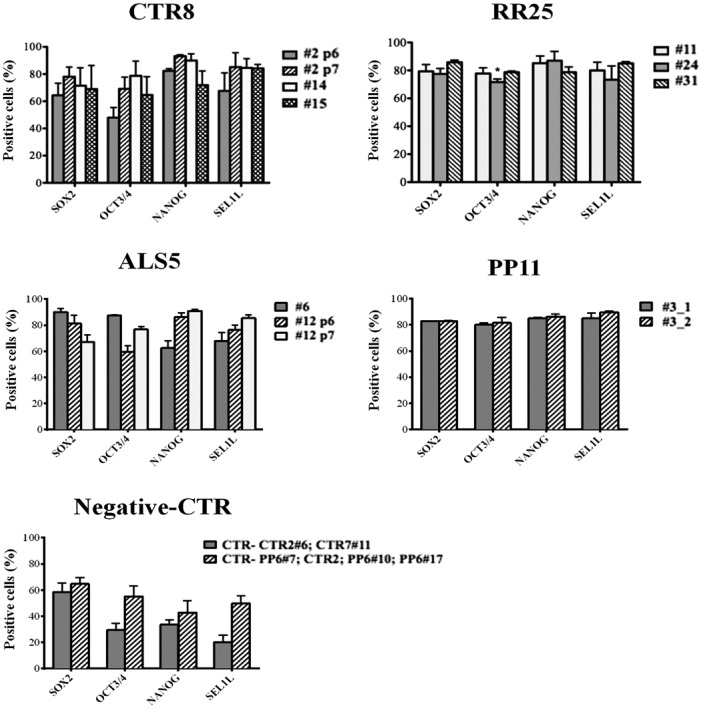
Figure 5.
Quantification of marker expression. Immunoquantification of marker positivity was established automatically using TissueQuest software. The histogram indicates the percentage of positive cells ± standard deviation for each marker. Levels of pluripotency markers expression allowed to identify the best clone for each cell line for CTR8 cell line: CTR8 #2p7 was selected as the best clone. RR25 cell lines showed similar levels for all the clones. ALS5 cells were characterized by high variability, suggesting incomplete reprogramming. Reliability of cell line macroarray coupled to TissueQuest analysis was supported by overlapping levels of markers expression for technical independent replicates of PP11#3 clone (_1 and _2) and by low expression of pluripotency markers in the abortive clones (negative control samples, CTR−).

