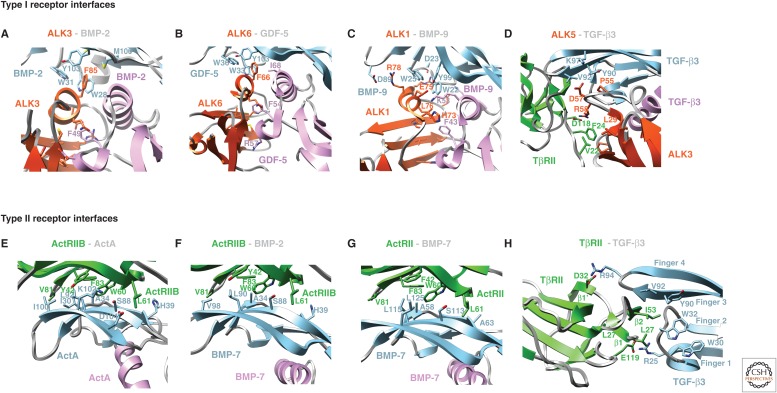
Figure 9.
Type I and type II receptor–GF interfaces. Interfaces show growth factors (GFs) bound to type I receptors (A–D) or type II receptors (E–H). Cartoon diagrams show GFs as pink and light blue monomers, and type I and type II receptors in red–orange and green, respectively, with key side chains in stick with carbons in the same colors, red oxygens and blue nitrogens. Structures correspond to those in the Figure 8 legend.

