
Figure 1.
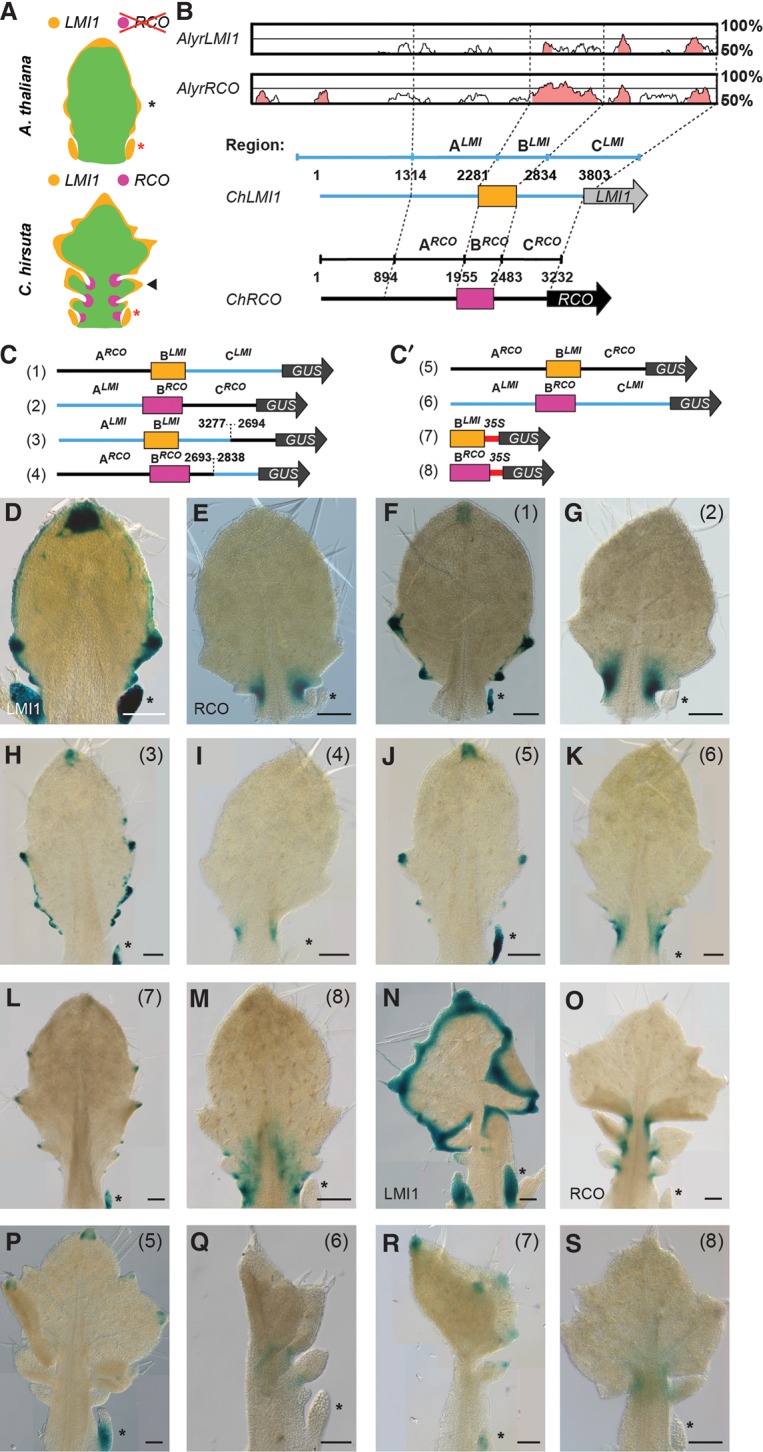
ChRCOenh500 is sufficient to drive proximal expression in the leaf lamina and evolved via modification of an enhancer driving distal expression in the leaf lamina. (A) Cartoon depicting leaf primordia of A. thaliana (top; black star indicates serration) and C. hirsuta (bottom; black arrowhead indicates leaflet). Red stars indicate stipules located at the leaf base. LMI1 (orange) and RCO (magenta) expression is shown. (B, top) mVISTA plot of Arabidopsis lyrata LMI1 and RCO upstream sequence aligned to C. hirsuta RCO, indicating sequence conservation (50%–100%) (mVISTA alignments with additional species are shown in Supplemental Fig. 1). Pink indicates conserved nucleotide sequences (CNSs; identity >70% within 100 base pairs [bp]). (Bottom) Subdivision of LMI1 and RCO upstream sequences into regions A, B, and C based on CNSs. ChLMI1 and ChRCO gene models (blue and black lines, respectively) with the CNS enhancer element of ∼500 bp indicated. (Orange) BLM1; (magenta) BRCO. (C,C′) Chimeric GUS reporter constructs (1–8) used to identify critical cis-regulatory elements in ChLMI1 and ChRCO upstream regions. (D–S) Representative A. thaliana (D–M) and C. hirsuta (N–S) GUS-stained leaves carrying reporter constructs depicted in C and C′ or full-length 3.8-kb ChLMI1 (D,N) and 3.2-kb ChRCO (E,O) upstream regions (see also Vlad et al. 2014). In each image, the construct used is indicated (1–8). The A. thaliana leaf depicted in L is more mature, hence the higher number of serrations. Each image contains at least one stipule (black star) to visualize the presence (LMI1) or absence (RCO) of expression. In each case, at least two independent T2 lines were analyzed with n > 5. Bar, 100 μm.