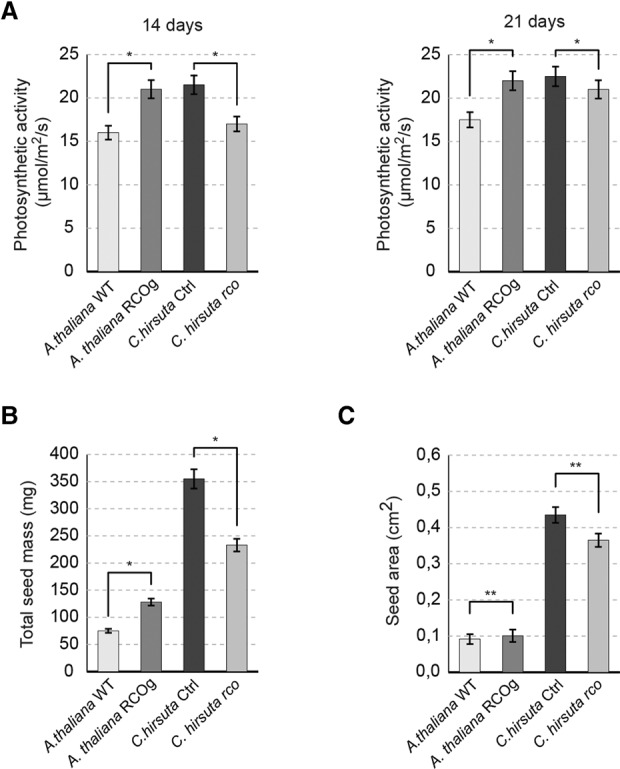
Figure 4.

Alterations in RCO activity influence plant physiological performance. (A–C) Level of photosynthesis (CO2 absorbed per second, normalized to rosette area) after 14 and 21 d of growth (A), total seed mass per plant (B), and seed area (C) for A. thaliana wild type and RCOg and C. hirsuta control (Ctrl) and rco. Five replicates were measured per genotype at each time point to analyze photosynthetic activity. Total seed mass was estimated from five plants per genotype. The seed area was obtained from 50 seeds per genotype derived from five plants. Error bars represent standard deviation. A t-test was used to calculate significance. (N.S.) Not significant; (*) P < 0.05; (**) P < 0.01; (***) P < 0.001.
