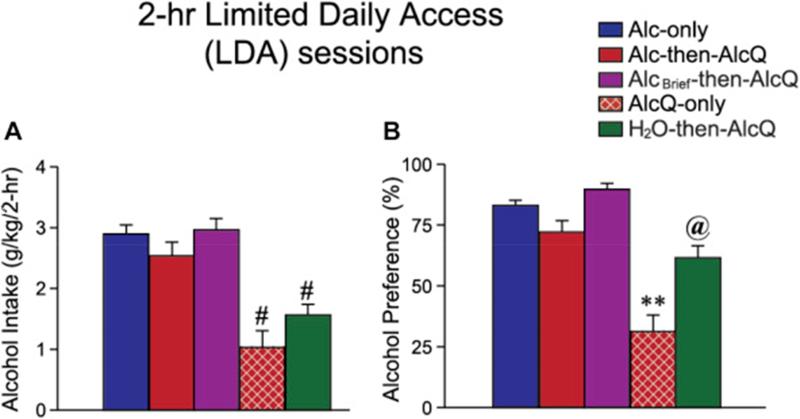
Fig. 3.
Mice given access to alcohol-only during the initial, protracted intake session showed aversion-resistance during subsequent LDA intake. Alcohol intake (A) and preference (B) in different experimental groups during Week 2 of LDA intake. Sample size for each experimental group is given in the legend of Fig. 2. Data are shown as mean ± SEM. #p < 0.05 between indicated group and Alc-only, Alc-then-AlcQ and AlcBrief-then-AlcQ mice; **p < 0.01 versus all other groups; @p < 0.05 between indicated group and Alc-only, AlcQ-only, and AlcBrief-then-AlcQ mice.

