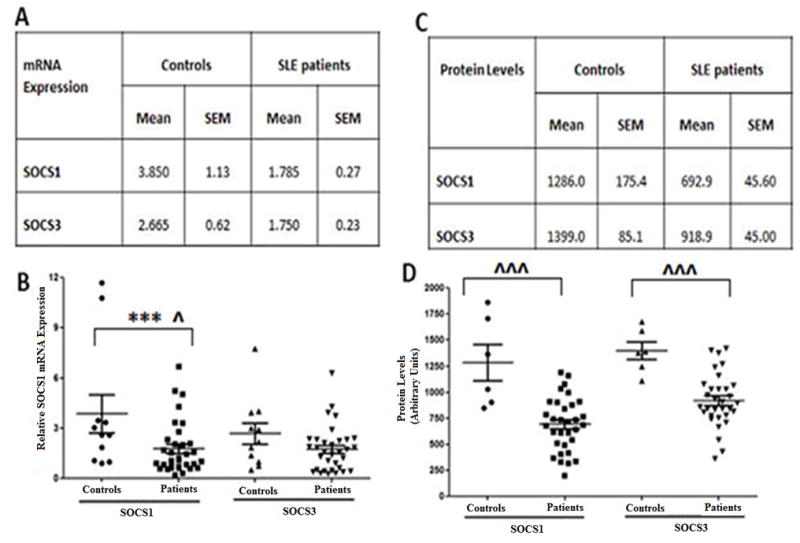
Figure-2. Reduced mRNA and Protein levels of SOCS1 and SOCS3 levels in SLE patients.

(A) table represents the average SOCS1 and SOCS3 mRNA expression (mean ± SEM) via real time RT-PCR, relative to GAPDH in SLE patients (N=33) versus controls (N=11). (B) Graph relative SOCS1 and SOCS3 message levels for SLE patients (N=33) and controls (N=11). Each dot represents an individual subject. (C) Table represents the average SOCS1 and SOCS3 protein levels (arbitrary Units mean ± SEM) for SLE patients (N=32) compared to controls (N=6). (D) Graph showing basal SOCS1 and SOCS3 protein levels present in SLE patients (N=32) and controls (N=6) as a graphical representation of densitometry values obtained through analysis of (Figure S3). Each dot represents an individual patient data points. Correlation was considered significant at 0.05 level (2 tailed).
