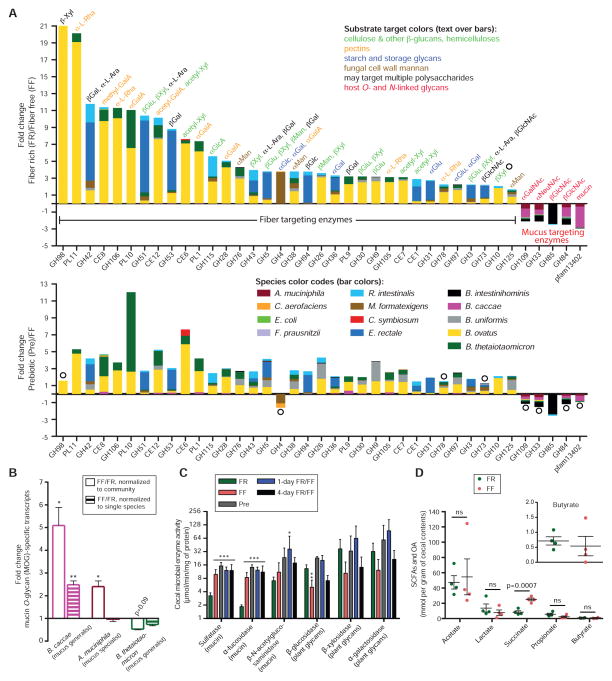
Figure 3. Diet-specific changes in carbohydrate active enzyme expression reveal a community shift from fiber to mucus degradation.
(A) Positive and negative fold-changes in transcripts encoding carbohydrate active enzymes (CAZymes) between either FR/FF (top) or Pre/FF (bottom) comparisons. Only CAZyme families (x-axis) in which >2-fold changes and p < 0.05 (Student’s t-test) were observed for all of the genes in that family in RPKM-normalized cecal community transcriptomes are shown as averages; open circles denote statistically insignificant differences. n = 3 mice/group, Experiment 1.
(B) Fold-change values of empirically validated (Table S5), MOG-specific transcripts of three mucus-degrading bacteria. n = 3 mice/group, Experiment 1. Data are shown as average ± SEM. Student’s t-test
(C) Activities of cecal enzymes determined by employing p-nitrophenyl-linked substrates. n = 4 for FR and FF groups and n = 3 for other groups, Experiment 1. Data are shown as average ± SD. One-way ANOVA, FR diet group vs. other groups.
(D) Concentrations of organic acid (OA, succinate) and short-chain fatty acids (SCFA) determined from cecal contents. n = 4 mice/group; 2 mice/dietary group in two independent experiments (#2A and 3). Student’s t-test.

