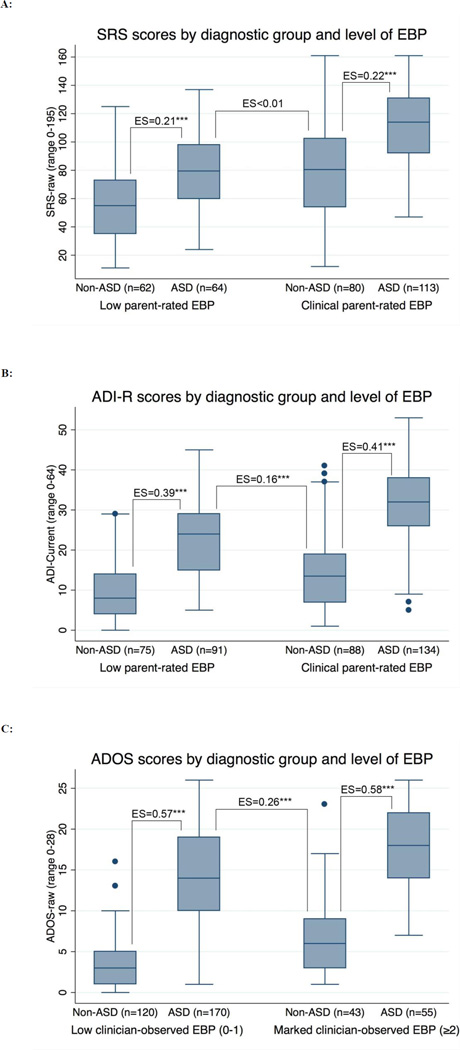
Figure 1.
(A, B, C): Box-plot diagrams showing the distributions of autism symptom scores for children with and without autism spectrum disorder (ASD) by level of emotional/behavioral problems (EBP), and effect sizes of the mean differences between diagnostic groups (non-ASD versus ASD).
Note: ASD=autism spectrum disorder, SRS=Social Responsiveness Scale, ADI=Autism Diagnostic Interview-Revised, ADOS=Autism Diagnostic Observation Schedule, Parent-rated EBP=Child Behavior Checklist Externalizing or Internalizing scale in clinical range (T≥64). Clinician-observed EBP=ADOS Other Abnormal Behaviors section. ES=effect size (partial eta squared),*p<0.05, ** p<0.01, *** p<0.001.

