
Fig. 3.
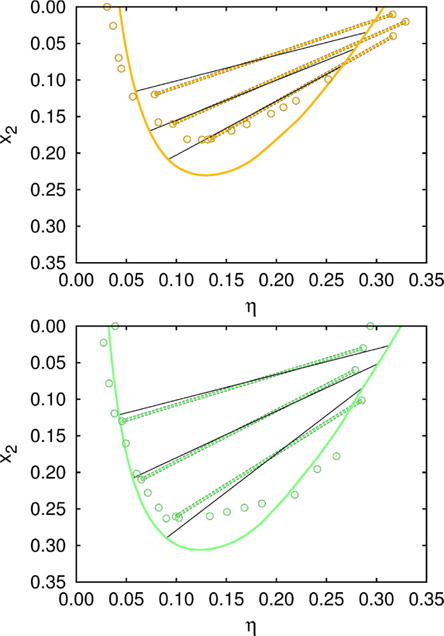
Isotherms at 268.5 K (green–bottom), and 270.5 K (orange–top). Circles show experimental data, while the solid lines represent calculations. In addition, we compare the experimentally determined tie–lines39 (dashed green/orange lines), with those calculated (black solid lines). Experimental data for the isotherm at 268.5 K (without the tie–lines) were together with the measurements for x2 = 0 (Fig. 4) used to fix the model parameters, collected in Table 1. Other results, including the isotherm at 270.5 K and the tie–lines for both temperatures, were than calculated using these values.