
Fig. 4.
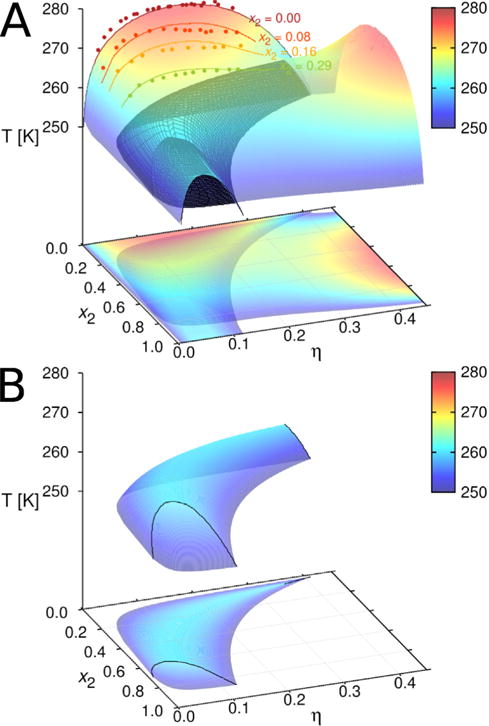
Panel A: phase separation of the γD–βB1 mixture in 0.1 M phosphate buffer at pH = 7.0. We show the equilibrium surface and its projections on the η–x2 plane. Experimental results are denoted by points and calculations by lines. The comparison is shown for x2 values equal to 0, 0.08, 0.16, and 0.29. The three–phase region (black shaded area) is embedded into two–phase region for temperatures below 264 K. Panel B: for easier visualization we re–plotted the three–phase region. Coexisting phases are denoted by black lines, see also the isotherm at T = 255 K in Fig. 5.