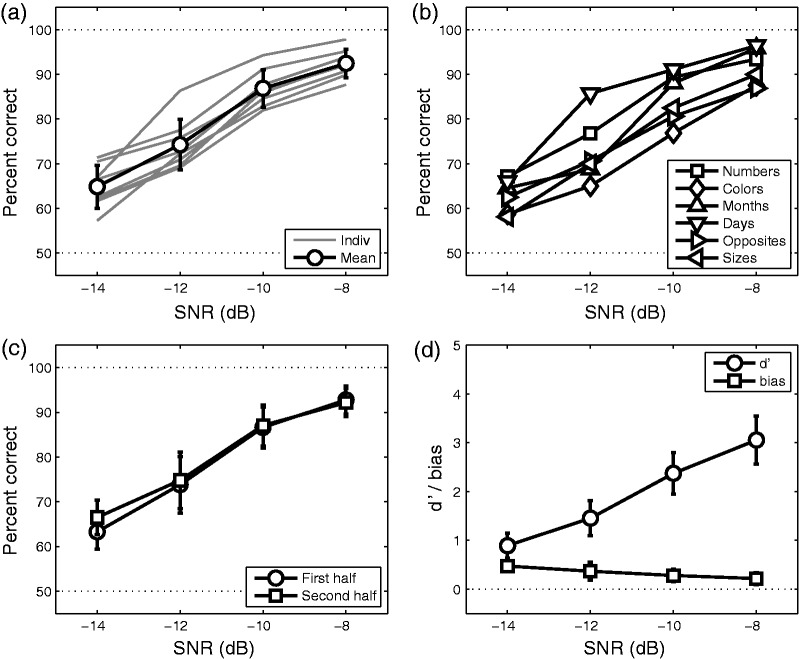
Figure 1.
(a) Psychometric functions for each listener (gray lines) and the mean psychometric function (black lines and circles). (b) Mean psychometric functions for each category type. (c) Mean psychometric functions based on the first half (circles) and second half (squares) of the trials completed by each subject at each SNR. (d) Mean psychometric function in units of d′ (circles) and bias (squares). Error bars, where shown, represent across-subject standard deviations.

