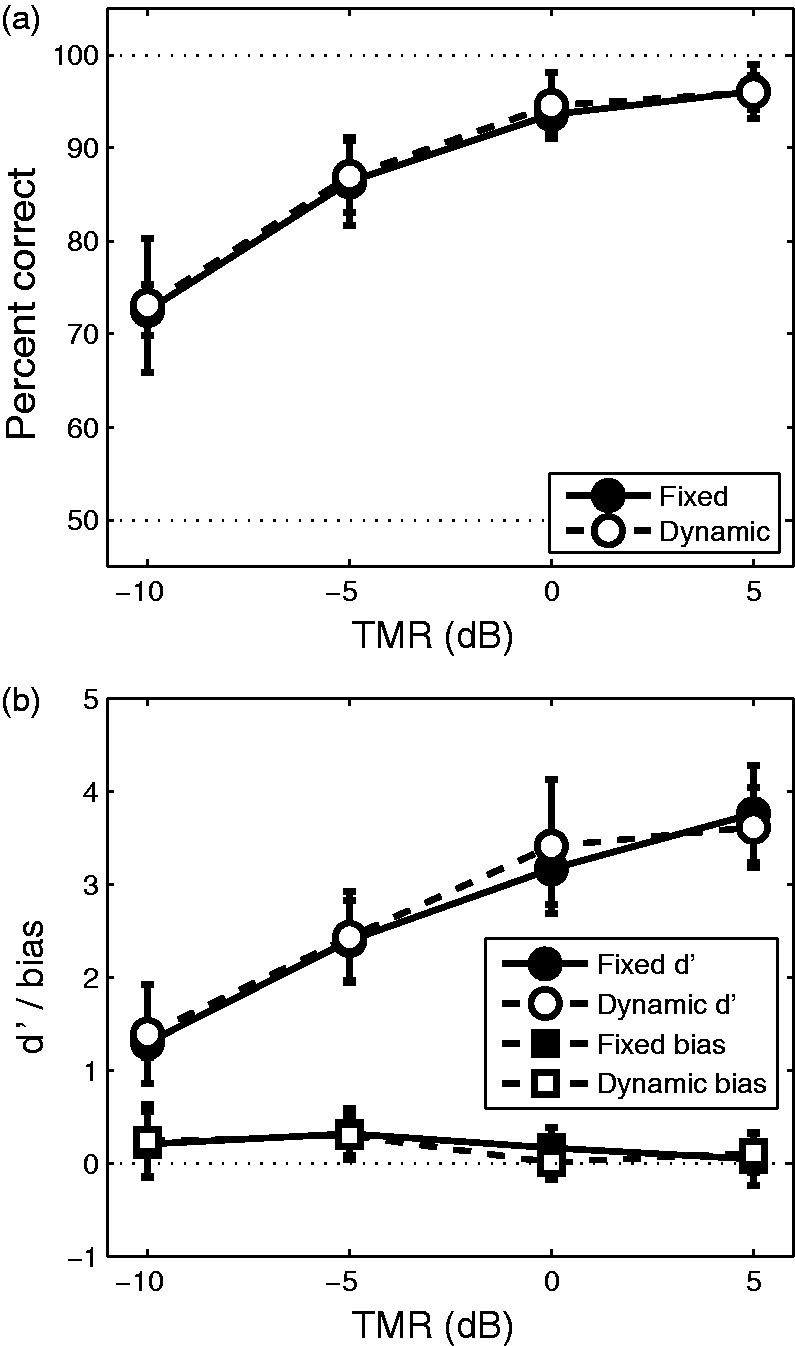
Figure 3.

(a) Psychometric functions for the fixed and dynamic listening conditions (averaged across all locations and all listeners). (b) Psychometric functions in units of d′ (circles) and bias (squares) for the fixed and dynamic listening conditions (averaged across all locations and all listeners). Error bars in both panels show across-subject standard deviations.
