Figure 2.
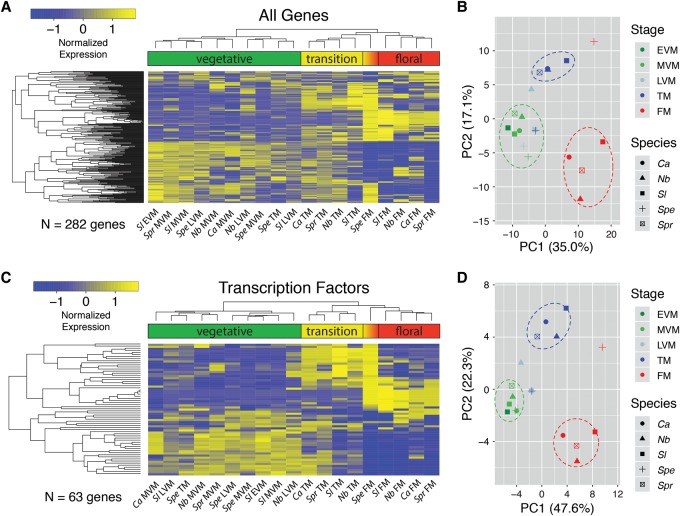
Clustering and principal component analysis (PCA) of dynamically expressed (DE) genes during meristem maturation. RNA-seq was used to quantify gene expression in the EVM, MVM, LVM, TM, and FM stages. (A) EdgeR was used to identify dynamically expressed genes between meristem stages within each species (Methods). Expression was Z-score normalized within species, and hierarchical clustering was visualized by heatmap, with hot colors (yellow) indicating higher expression and cold colors (blue) lower expression. Clustering generally grouped vegetative, transition, and floral meristem stages together, with the exception of the Spe TM and FM, which associated with vegetative and transition clusters, respectively, reflecting the severe delay in meristem maturation compared to Sl (Park et al. 2012). (B) PCA of normalized expression from DE genes. The first two PCs account for ∼52% of the overall variation, with PC1 primarily accounting for differences between vegetative and floral meristem stages. PC2 primarily separates the transition stage from vegetative and floral. Regions where the majority of vegetative, transition, and floral samples cluster together are indicated by green, blue, and red dashed ovals, respectively. Three notable outliers from the main vegetative, transition, and floral groups include the Spe TM and FM, and the Nb LVM, reflecting heterochronic shifts in expression that imply a delay (Spe) and acceleration (Nb) in meristem maturation. Heatmaps (C) and PCA (D) based on 63 DE transcription factors also reflect heterochronic shifts in expression and maturation schedules.

