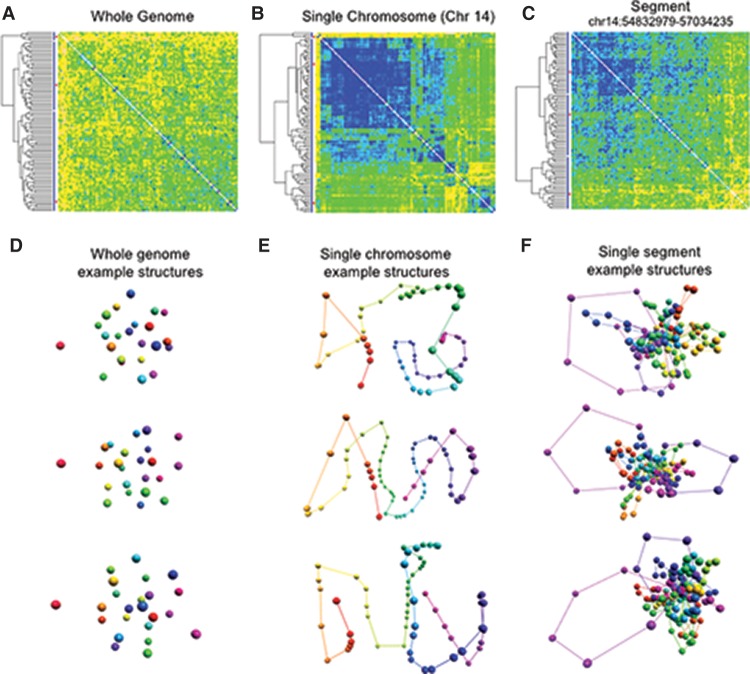
Figure 5.
Structural ensemble analysis for GM12878 cells at different resolutions. For each resolution, we generated 100 structures and constructed a matrix of pairwise distances between structures, which were hierarchically clustered. (A) The matrix of pairwise distances for the whole-genome models at the chromosome level. The differences between clusters are small, suggesting that the simulation on this level yields very similar results across different runs. (B) The matrix of pairwise distances between structures of Chromosome 14. Three large clusters dominate the set, and their extent is indicated by the red bars on the left. (C) The matrix of pairwise distances between three-dimensional structures for a subloop level model of a single TAD (Chr 14: 54832979–57034235). While there are visible differences between some of the structures, the clusters are not as well-defined, suggesting that several conformations of this region are present in the cell population. (D) Selected whole-genome structures from the three main subpopulation clusters identified in A. (E) Selected single chromosome structures from the main subpopulation clusters identified in B. (F) Selected single segment structures at the subloop level from the main subpopulation clusters identified in C.

