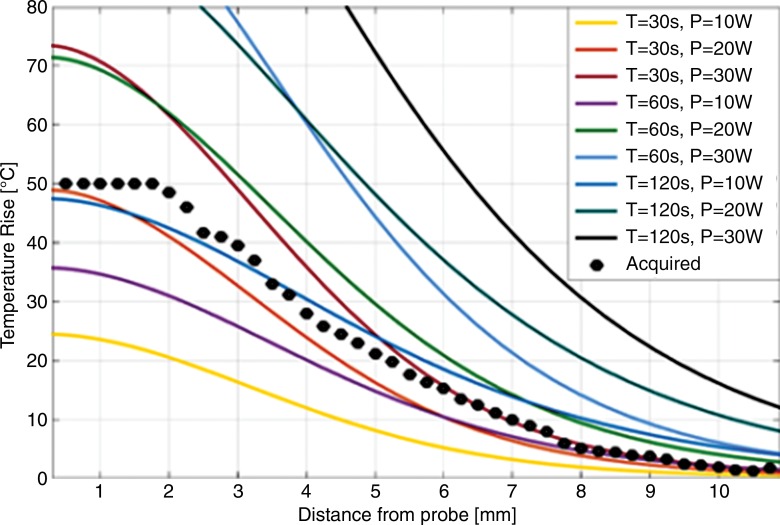
Figure 1:
Graph shows computed temperature increase profiles 20 seconds after termination of ablation at various power (P) levels in watts versus radial distance from the probe (solid lines). Experimental MR imaging thermometry data acquired from bovine muscle tissue with power of 30 W and time (T) of 120 seconds are plotted as points (also see Fig 2).

