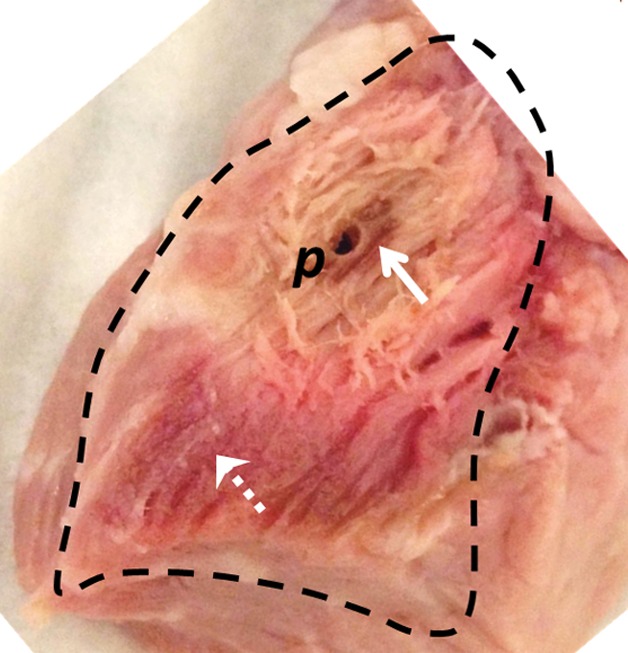
Figure 2b:

(a) MR thermometry image shows the temperature distribution during ablation (power of 30 W and time of 120 seconds). The dark red mask around the probe corresponds to areas with temperatures above 75°C. (b) Gross photograph shows that brown discoloration of the lesion is evident after ablation (solid arrow), while unaffected tissue remains pinkish (dashed arrow). Slight changes in the shape of the tissue before and after ablation are caused by the effects of ablation and saline immersion. p = probe.
