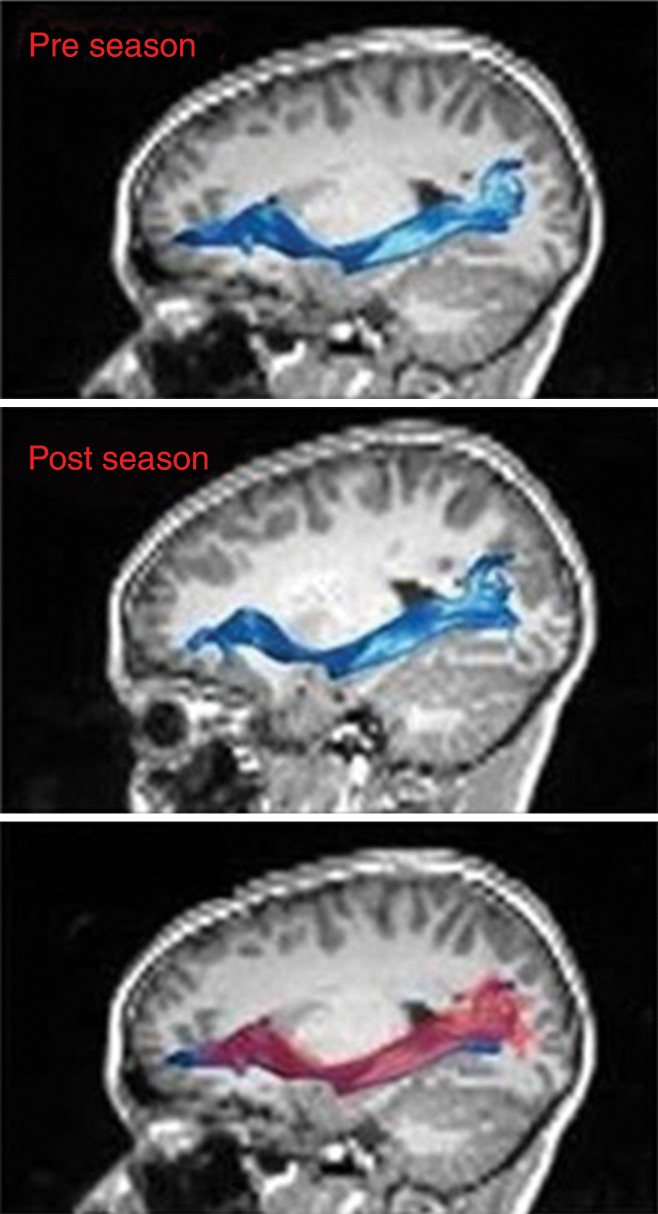
Figure 1b:
(a) Linear regression plot depicts the relationship between percent change of FA of the left IFOF and cumulative exposure. The blue shaded area indicates the estimated confidence interval region around the true regression line. RWECP = RWECP. (b) MR images of left IFOF (top) before and (middle) after the playing season, and (bottom) the overlay. In the overlay (bottom), the red region is after the season and the blue region is before the season.

