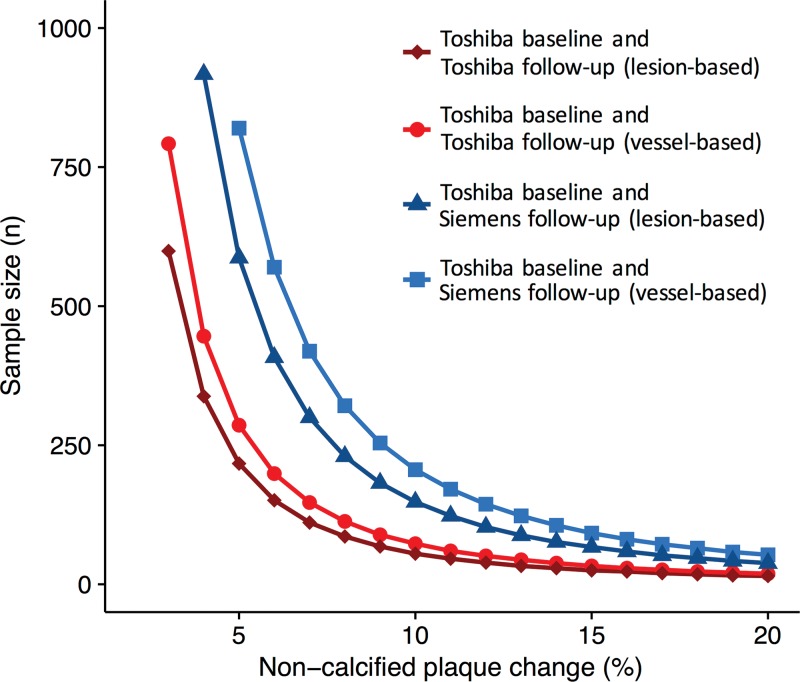
Figure 6:
Graph shows sample size required in each group to detect a change in noncalcified plaque with 90% power and an α error of .05. The x-axis represents the plaque volume change to be detected and the y-axis the corresponding sample size needed for a same-vendor study ( Toshiba baseline vs Toshiba follow-up) and a different-vendor study ( Toshiba baseline vs Siemens follow-up).

