
Table 4.
Effects of Reader and CT Scanner on Interstudy Variability of Coronary Plaque Measurements
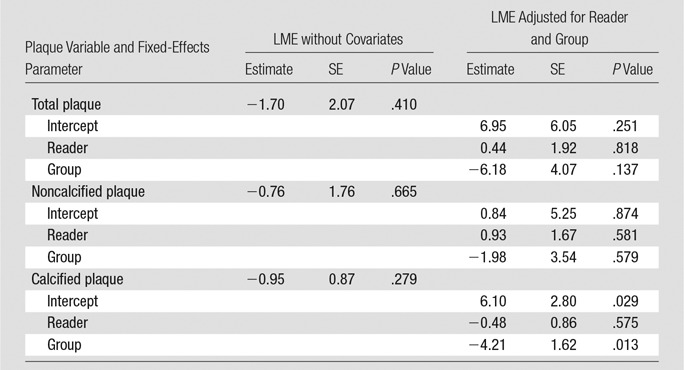
Note.—Parameter estimates, their standard errors (SEs) of the mean and corresponding P values were computed based on two linear mixed-effects models (LMEs). The P values are for testing the null hypothesis that the true value of the parameter is zero versus the nonzero alternative. The outcomes are the differences in plaque measurements (total plaque, noncalcified plaque, and calcified plaque). The two mixed-effects models were as follows: (a) LME without covariates (ie, with only fixed- and random-effects intercepts) and (b) LME adjusted for reader and group (ie, with fixed- and random-effects intercepts and fixed and random effects for group). The results were computed by using the R “lme4” package by treating the patients as clusters with repeated measurements obtained at the segments within each patient (16).