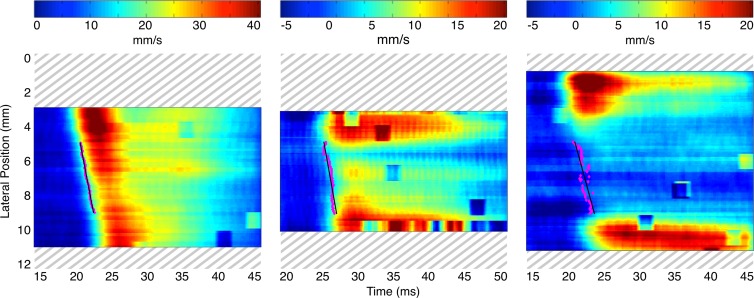
Figure 2:
Spatiotemporal maps of pulse wave propagation for the same mice as in Figure 1 show an aorta with no abnormalities (left), an aorta with a stable aneurysm (middle), and an aorta with an unstable aneurysm (right). Some regions along the borders of the field of view were cropped owing to poor displacement estimation (correlation coefficients of less than 0.9). The 50% upstroke markers and corresponding linear regressions are shown in a 4-mm-long window that spans lateral positions from 5 mm to 9 mm, which fall within the sacs of the aneurysms when these are present. The slope of each linear regression corresponds to the PWV. The normal case has the highest PWV (2.27 m/sec), while PWV is lower in the stable AAA (2.07 m/sec) and lowest in the unstable AAA (1.79 m/sec).

