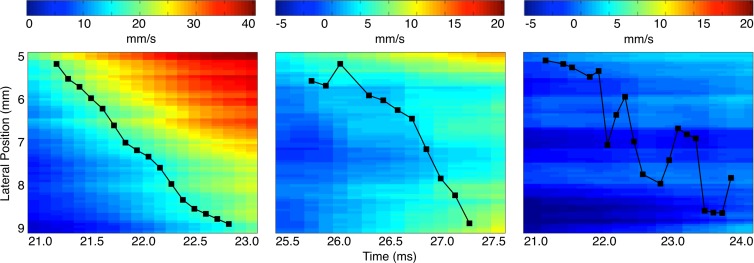
Figure 3:
Comparison of pulse wave propagation in the 5–9-mm segments of the spatiotemporal maps in Figure 2 shows an aorta with no abnormalities (left), an aorta with a stable aneurysm (middle), and an aorta with an unstable aneurysm (right). In cases where two or more consecutive marker locations corresponded to the same time point, the mean of these locations was selected. The slopes of the lines drawn between successive markers thus provide localized estimates of the PWV at the highest possible spatial resolution.

