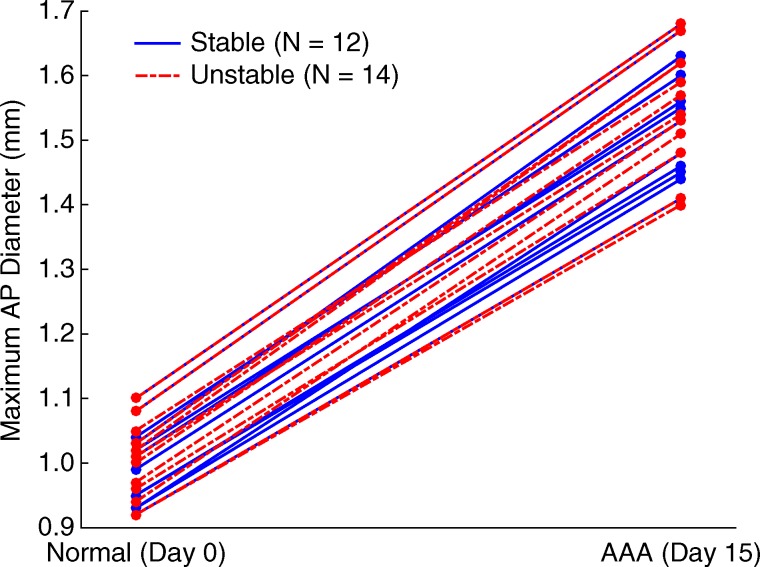
Figure 5b:
Group data regarding maximum AP diameter of the vessel for all mice in the study. (a) Box and whisker plot of subgroup means and standard deviations, (b) parallel coordinate plot of the normal baseline and AAA measurements for each mouse, and (c) box and whisker plot of the change in each mouse after AAA development, relative to their individual normal baseline values, are shown. The normal baseline data were acquired the day before angiotensin II infusion started (day 0), while the AAA data were acquired after 15 days of angiotensin II infusion (day 15). *** = P < .001/12, where 12 is the Bonferroni correction factor.

