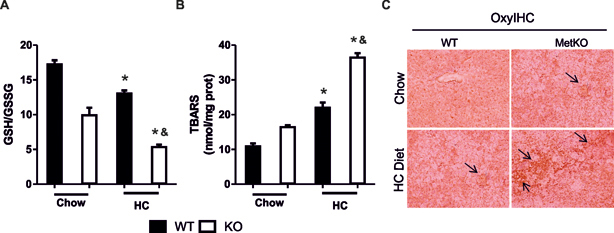
Fig. 4.
High-cholesterol diet exacerbates oxidative stress in MetKO mice. A: Glutathione ratio determined by HPLC as described in Materials and Methods. B: Lipid peroxidation. TBARS, thiobarbituric acid reactive substances. Each column represents mean ± SEM of at least four independent experiments. *p < 0.05 vs WT chow diet; &p< 0.05 vs WT high-cholesterol (HC) diet. C: Protein oxidation, carbonyl modification was determined by IHC using OxyIHC kit as described in Materials and Methods. Original magnification, X200. Arrows show oxidized protein areas. Images are representatives of at least four animals for each group.

