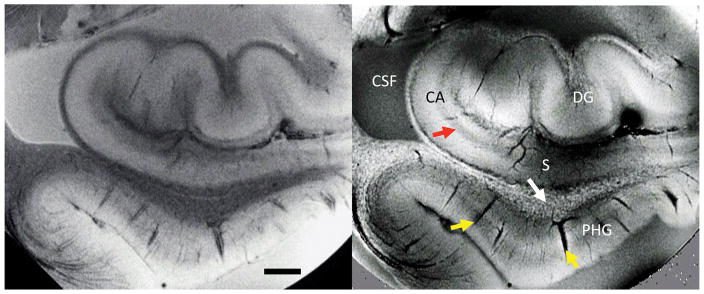
Figure 1.
SW MRI of ex-vivo hippocampal tissue. Signal amplitude (left) and phase (right) show distinctly different contrast. Regions such as dentate gyrus (DG), cornu ammonis (CA), subiculum (S), and parahippocampal gyrus (PHG) are readily identifiable. Strong contrast is seen in and around vessels (yellow arrows), at pyramidal cell layers (red arrow) and in white matter (speckles indicated with white arrow) attributed to iron in ferritin and deoxyhemoglobin. Measurements performed at 7 T, TE=30ms, 50x50x500mm resolution. Scale bar = 2 mm.

