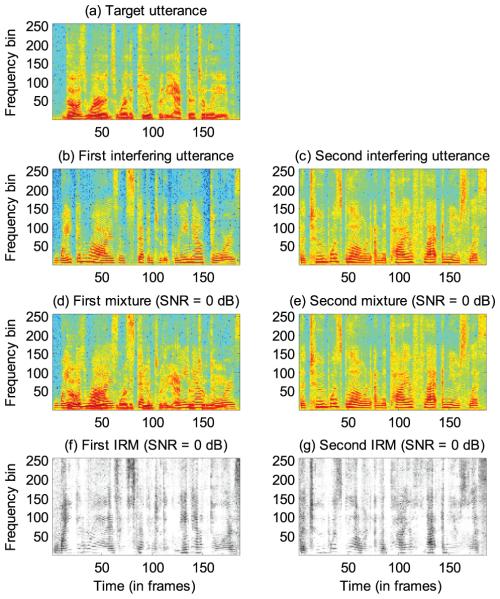
Fig. 3.
Comparison of mapping and masking when the number of the utterances of the target speaker is limited. (a) The spectrogram of the utterance of the target speaker. (b) The spectrogram of the first utterance of the interfering speaker. (c) The spectrogram of the second utterance of the interfering speaker. (d) The spectrogram of the mixed signal produced from the target utterance (i.e. Fig. 3a) and the first interfering utterance (i.e. Fig. 3b). (e) The spectrogram of the mixed signal produced from the target utterance and the second interfering utterance (i.e. Fig. 3c). (f) The IRM of the target utterance given the first interfering utterance. (g) The IRM of the target utterance given the second interfering utterance.

