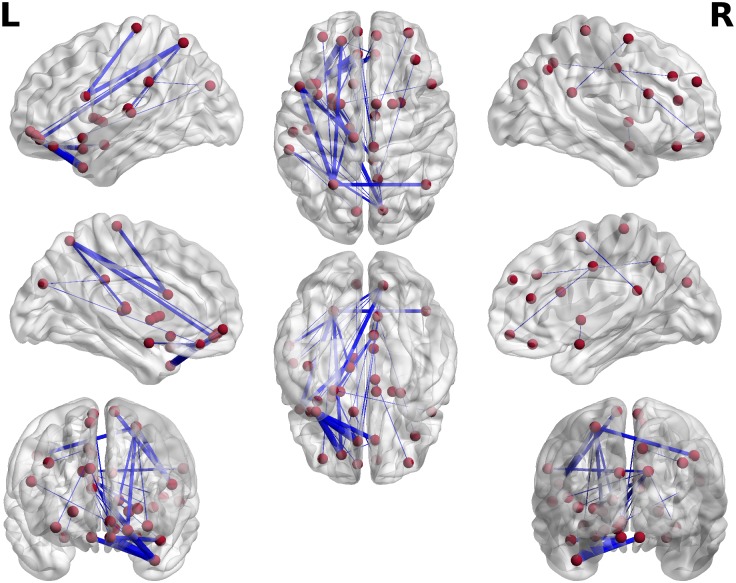
Fig 5. Spatial distribution of 33 best features (connectivity at alpha frequencies), which were used for prediction (see Fig 3).
The red spheres indicate the location of the 33 best features (connections) for detection of mTBI, while the blue lines represent the inter-regional alpha connections (features). Line thickness denotes the robustness of contribution of specific features across subjects. The same connectiones are plotted in Fig 8B in a matrix form.

