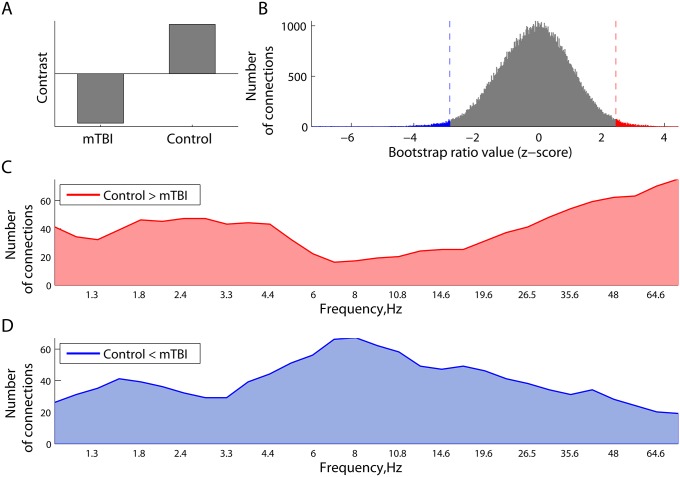
Fig 6. Differences in phase synchrony between the mTBI and Controls in the PLS analysis.
Panel (A) illustrates the contrast between two groups. Expression of this contrast is shown in (B) as the distribution of all the bootstrap ratio values for phase-locking value between each pair of regional neuromagnetic sources at all frequencies. The distribution of these effects across frequencies, related to a decrease (C) and increase (D) in phase synchrony in mTBI participants relative to controls is plotted as the number of connections whose bootstrap ratio values belong to the corresponding 1% tails. The mTBI participants expressed reduced connectivity in the δ and γ band and hyperconnectivity at α frequencies.

