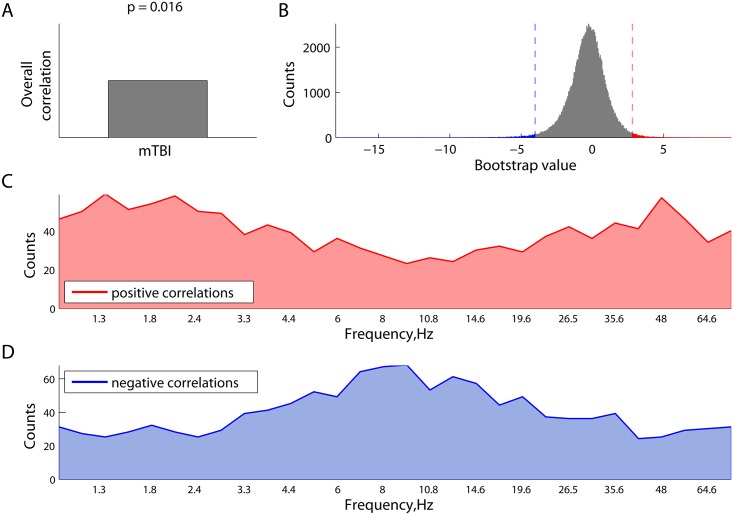
Fig 10. Characteristic temporal scales of the correlations between the phase synchronization and and the length of time elapsed between injury and scan, as revealed by behavioural PLS analysis.
(A) overall correlation (similar to the contrast in contrast PLS); (B) overall distribution of all the bootstrap ratio values, each associated with a unique combination of frequency point and source pairing (the tails represent the most robust effects); (C) strength of the effects of positive correlations between phase-locking and time of scanning, expressed as frequency-specific number of connections from the right (red) tail in Panel B; and (D) frequency-specific number of connections from the left (blue) tail in Panel B, reflecting the negative correlations between phase synchrony and time of scanning.

