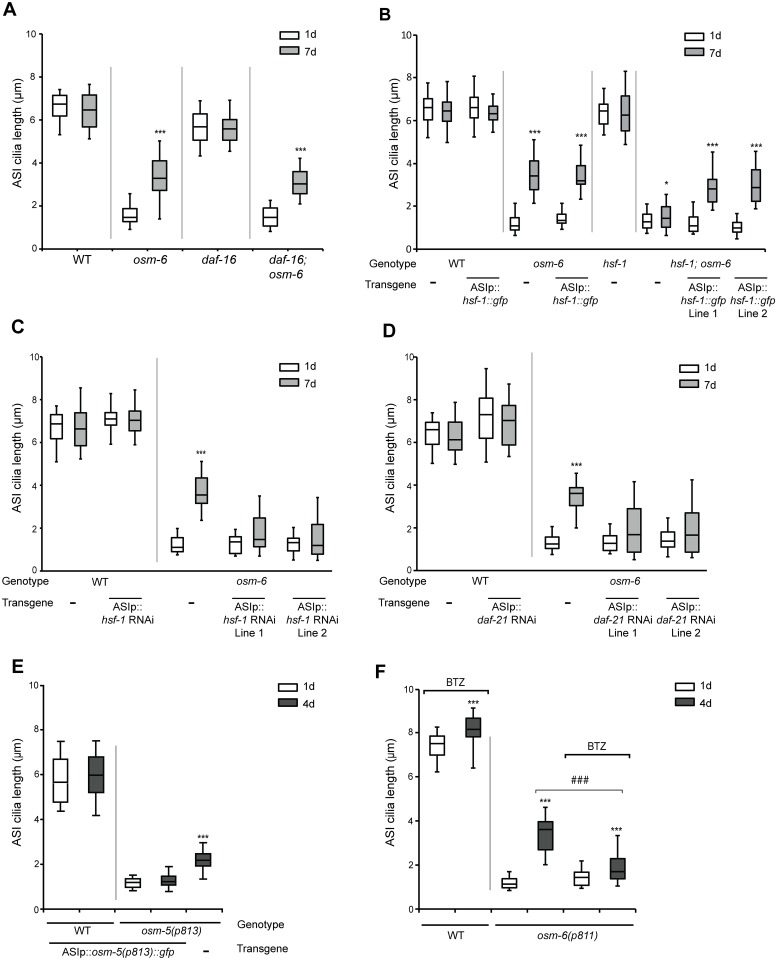
Fig 5. Improved protein quality control mechanisms may underlie age-dependent cilia recovery in IFT mutants.
(A-D) Quantification of ASI cilia length in animals of the indicated genotypes and adult ages. Alleles used were osm-6(p811), daf-16(mu86), and hsf-1(sy441ts). ASI cilia were visualized via expression of str-3p::srg-36::gfp (A,C,D) or srg-47p::TagRFP (B). An hsf-1 cDNA tagged with gfp, and hsf-1 and daf-21 sense and antisense sequences were expressed in ASI under the srg-47 promoter. Lines 1 and 2 represent independent transgenic lines. Animals were grown at 20°C (A,C,D) or 25°C (B). Horizontal lines indicate 25th, 50th and 75th percentiles; bars indicate 5th and 95th percentiles. * and *** indicate different from 1d within a genotype at P<0.05 and 0.001, respectively (Wilcoxon Mann-Whitney U test). n>30 for each; ≥3 independent experiments. (E) Quantification of ASI cilia length in 1d and 4d old animals of the indicated genotypes, expressing srg-47p::osm-5(p813)::gfp. ASI cilia were visualized via expression of srg-47p::TagRFP. Horizontal lines indicate 25th, 50th and 75th percentiles; bars indicate 5th and 95th percentiles. *** indicates different from 1d of the same genotype at P<0.001 (Wilcoxon Mann-Whitney U test). n>50 each; 3 independent experiments. (F) Quantification of ASI cilia length in 1d and 4d old animals of the indicated genotypes. ASI cilia were visualized via expression of str-3p::srg-36::gfp. Animals were grown on 10 μM Bortezomib (BTZ). Horizontal lines indicate 25th, 50th and 75th percentiles; bars indicate 5th and 95th percentiles. *** indicates different from 1d within a genotype at P<0.001; ### indicates different between the indicated conditions at P<0.001 (Wilcoxon Mann-Whitney U test). n>50 each; 3 independent experiments.

