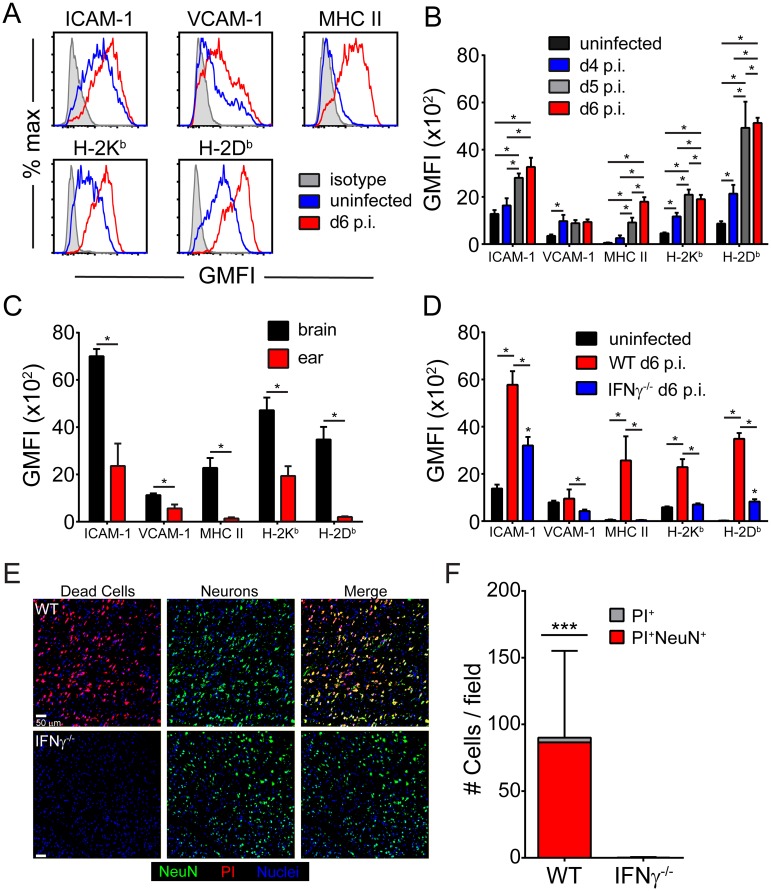
Fig 6. Cerebral ECs upregulate antigen presenting and adhesion molecules in an IFNγ-dependent manner.
(A) Representative histograms from naïve (blue) and d6 p.i. (red) mice show the expression antigen presenting (Db, Kb, MHC II) and adhesion molecules (ICAM-1, VCAM-1) on live CD45- CD31+ ECs. Isotype control antibody staining is shown in gray. (B) The bar graph depicts the geometric mean fluorescent intensity of the denoted molecules on cerebral ECs extracted from naïve, d4 p.i., d5 p.i., and d6 p.i. mice (mean ± SD; n = 5 mice per group). (C) The bar graphs shows expression of the same molecules on ECs extracted from the brain vs. ear of mice at d6 p.i. (mean ± SD; n = 5 mice per group). (D) Expression of antigen-presenting and adhesion molecules on cerebral ECs were quantified for naïve, wild type d6 p.i., and IFNγ-/- d6 p.i mice (mean ± SD; n = 5 mice per group). Note that IFNγ deficiency restores expression to near baseline levels. Data in this figure are representative of two independent experiments. (E) Representative confocal images of the brainstem from a symptomatic wild type mouse (top) or an IFNγ-/- mouse at d6 p.i. following propidium iodide (red) injection and immunohistochemical staining for NeuN+ neurons (green). Cell nuclei are shown in blue. (F) The bar graph shows quantification of data in (E). Each bar represents the total number of brainstem cells that are PI+ (gray), and within the bar, the red coloration shows the proportion that are also NeuN+ (mean ± SD; n = 4 mice per group; 1 brain section per mouse; 4 images per brain section). Asterisks denote a statistically significant difference from all other groups (***P < 0.05).

