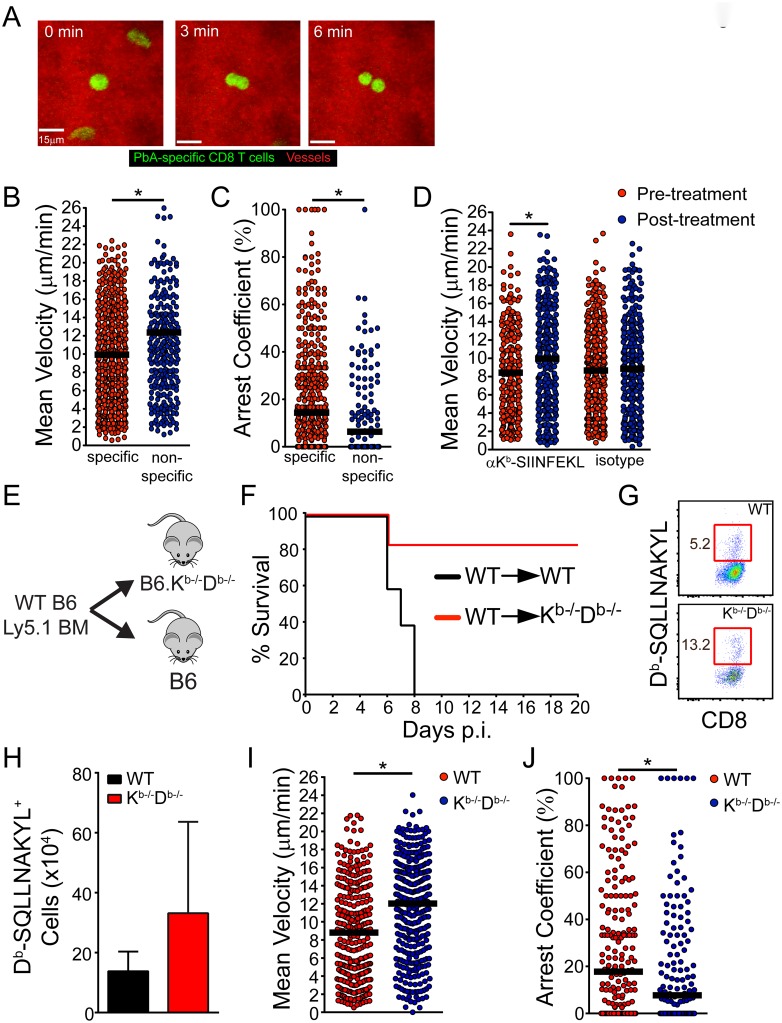
Fig 8. Fatal PbA-specific CD8+ T cell interactions with cerebrovascular ECs are cognate peptide MHC I dependent.
(A) Representative maximal projections of a 3D time lapse shows a PbA-specific CD8+ T cell (green) dividing along the luminal surface of a cerebral blood vessel (red) at d6 p.i. The mouse was seeded with 104 naïve mCerulean+ OT-I cells and infected with PbA-OVA-mCherry. See corresponding S10 Movie. (B and C) Quantification of PbA-specific CD8+ T cell velocities (B) and arrest coefficients (C) within the cerebral vasculature of d6 p.i. mice seeded with 104 mCerulean+ OT-I cells and infected with PbA-OVA-mCherry. Intravenously injected YFP+ P14 cells served as the non-specific bystander control CD8+ T cells for this experiment. Each dot represents an individual T cell, and horizontal black bars denote the group mean. Data are representative of 7 independent experiments. (D) Quantification of PbA-specific CD8+ T cell velocities within the cerebral vasculature of d6 p.i. mice before and after i.v. injection of anti-Kb-SIINFEKL or isotype control antibodies. Each dot represents an individual T cell, and horizontal black bars denote the group mean. Data are representative of 4 independent experiments. (E) Design of bone marrow (BM) chimeras used to collect the data shown in (F-J). (F) Survival curves of PbA-infected wild type (WT) into WT and WT into Kb-/-Db-/- BM chimeras (n = 5 per group; 2 independent experiments). (G) Representative flow cytometric plots depicting the frequency (red boxes and adjacent numbers) of Db-SQLLNAKYL-specific CD8 T cells in the spleens WT→WT and WT→Kb-/-Db-/- BM chimeras. Plots are gated CD45+ Thy1.2+ CD8+ cells. (H) Quantification of data from (G) (n = 3 per group; 2 independent experiments). (I and J) Quantification of PbA-specific CD8+ T cell velocities (I) and arrest coefficients (J) within the cerebral vasculature of WT→WT and WT→Kb-/-Db-/- BM chimeras at d6 p.i. Mice were seeded with 104 naïve mCerulean+ OT-I cells and infected with PbA-OVA-mCherry. Each dot represents an individual T cell, and horizontal black bars denote the group mean. Data are representative of 7 independent experiments. Asterisks denote statistical significance (*P < 0.05).

