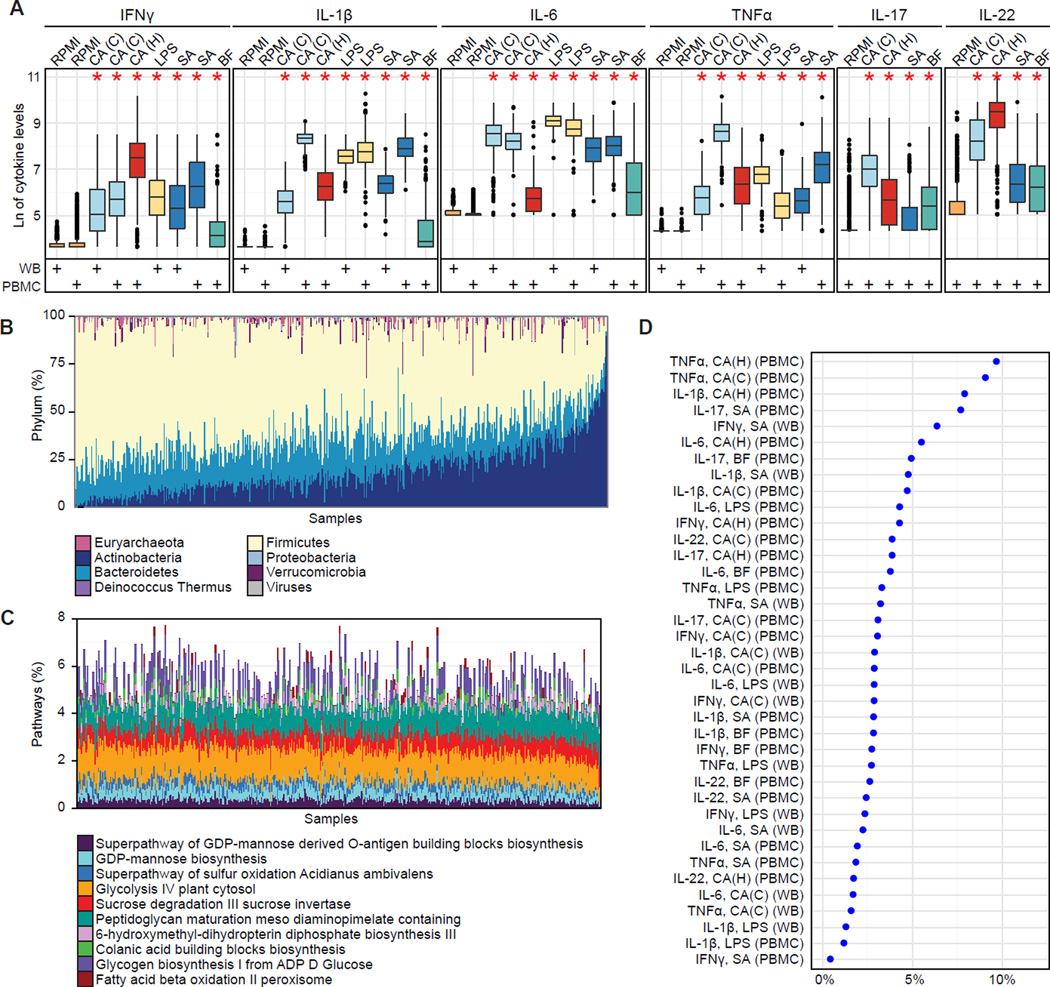
Figure 2. Healthy individuals show significant inter-individual variability in stimulated cytokine responses and in gut microbiota.
(A) Inter-individual variation in cytokine response. Each color represents a type of stimulation, also indicated on the upper x-axis: C. albicans conidia, CA(C); C. albicans hyphae, CA(H); E. coli-derived lipopolysaccharide 100 ng, LPS; S. aureus, SA; and B. fragilis, BF. Cell type is indicated below the x-axis (whole blood, WB; peripheral blood mononuclear cells, PBMC). The y-axis specifies the cytokine response. Each cytokine was measured in a non-stimulated control for each cell type (RPMI, orange). Stars indicate significant differences in variation for each stimulatory response compared to controls, respectively for each cell type (Fligner-Killeen test, all p < 1e-15). (Note that B. fragilis-induced TNFα measurements were not considered for further analyses due to a small degree of variation across individuals.) Whole blood measurements are based on 456 individuals. TNFα, IL-1β, and IL-6 measurements in PBMCs (1 d) were available for 401 individuals; IFNγ, IL-17, and IL-22 measurements in PBMCs (7 d) are based on 462 individuals.
(B) Taxonomic microbial profiles displaying phylum-level composition. Sample order was determined by the first principal component (PCA with Bray-Curtis distance).
(C) Functional microbial profiles displaying the abundance of the ten most variable MetaCyc pathways (based on variance). Samples are in the same order as in (B).
(D) The overall percentage of cytokine variation explained by species composition of the gut microbiome was 0.4–9.6%. To avoid overestimation due to species-species correlations, we represented the microbiota through the first 20 principal coordinates (PCoA with Bray-Curtis distance) which explain ∼50% of the variance. The cytokine variance explained by these principal coordinates was estimated through permutation ANOVA by summing over the significant contributions (p < 0.2).
See also Figure S2.

