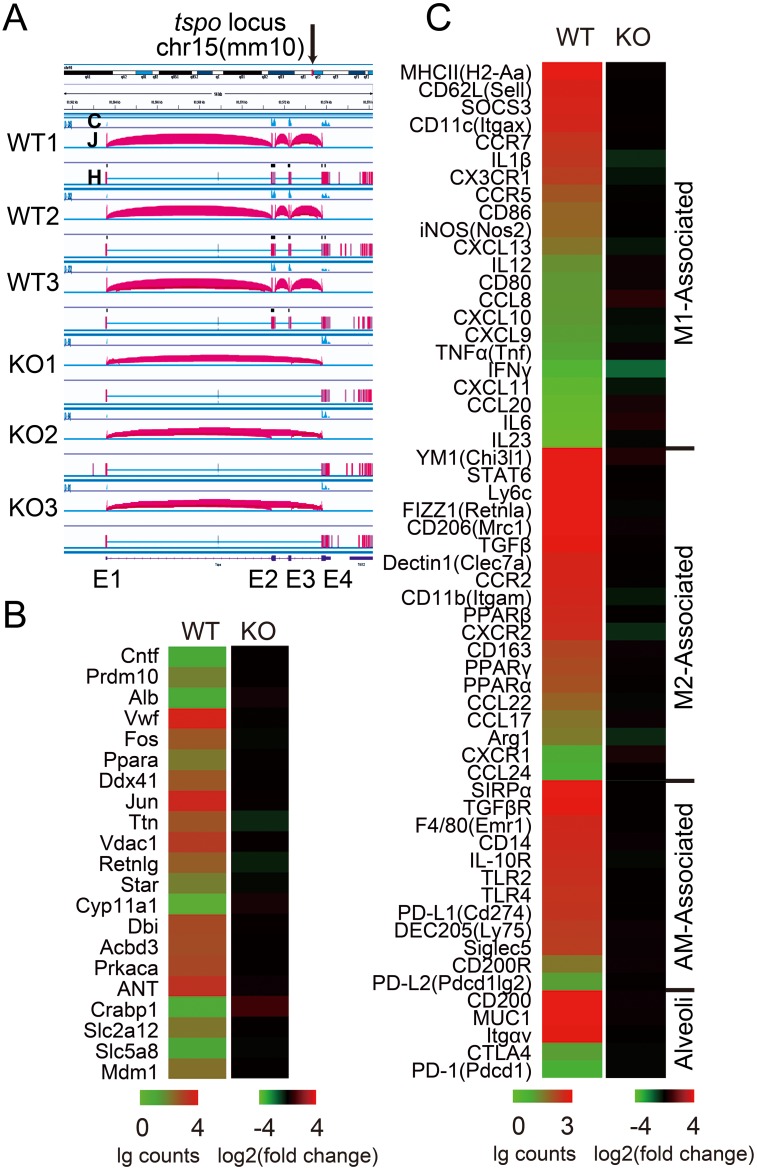
Fig 4. TSPO KO did not affect gene expression profiles.
(A) TSPO gene locus of WT and KO mice lung tissue samples used for RNA-seq, results visualized by Integrative Genomics Viewer (IGV) software (NIH), C: coverage of reads, J: junctions, H: hits; (B) Expression level of potential TSPO interaction proteins reported by literatures and SRING database (Version 10.0); (C) Expression profile of bronchoalveolar immune microenvironment associated genes; (B&C) Significant difference determined by negative binomial distribution test.

