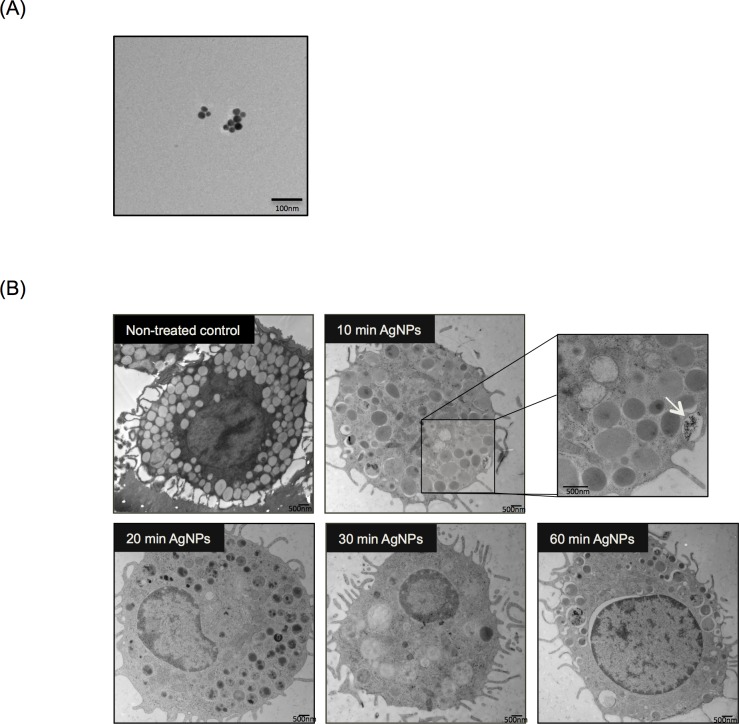
Fig 1. Time Course of Mast Cell Association of AgNPs.
(A) Representative Transmission Electron Microcopy (TEM) image demonstrating AgNP shape and size. (B) Representative TEM images of mast cells following exposure to 20 nm AgNPs over time. Mast cells were treated with AgNPs (25 μg/ml) for 10, 20, 30 and 60 min and AgNPs uptake by mast cells was assessed. Arrow indicates AgNPs that were being taken up by a mast cell (inset). A representative image was obtained from at least 5 different images.

