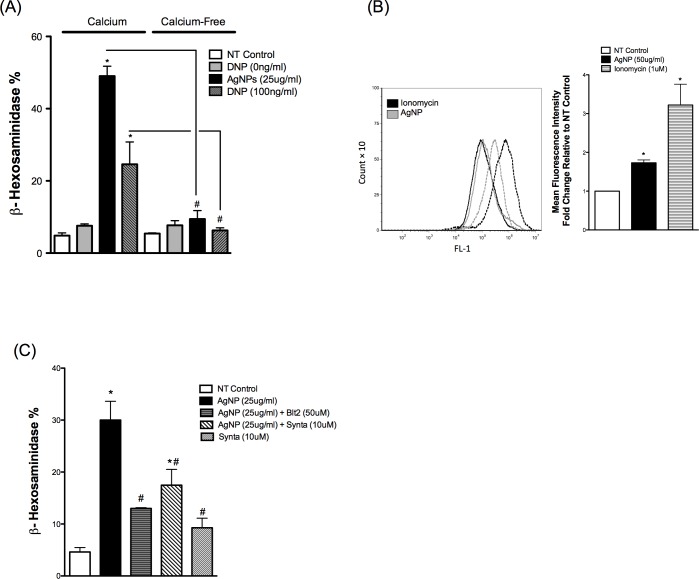
Fig 3. Calcium signal in mast cell following exposure to AgNPs.
Mast cell degranulation was assessed by measuring the release of β-hexosaminidase into supernatants. (A) Mast cells degranulation was measured following exposure to AgNPs in the presence and absence of calcium. (B–left panel) Cells were stained with Fluo-4 AM (5 μM) and mean fluorescence intensity was assessed before (baseline NT control, solid line) and after exposure to ionomycin (1 μM) or AgNPs (50 μg/ml) (dotted line) for 2 min. (B–right panel) A representative graph of 3 independent experiments showing fold change of mean fluorescence intensity relative to NT control. (C) Cells were pre-treated with the CRAC calcium channels inhibitor Synta (10 μM) 30 min prior to AgNP (25 μg/ml) exposure for 1 h and release of β-hexosaminidase was assessed. Values are expressed as mean ± SEM of at least 3 independent experiments. *Indicates significant difference from controlled group (p≤0.05). #Indicates significant difference from indicated groups (p≤0.05)

