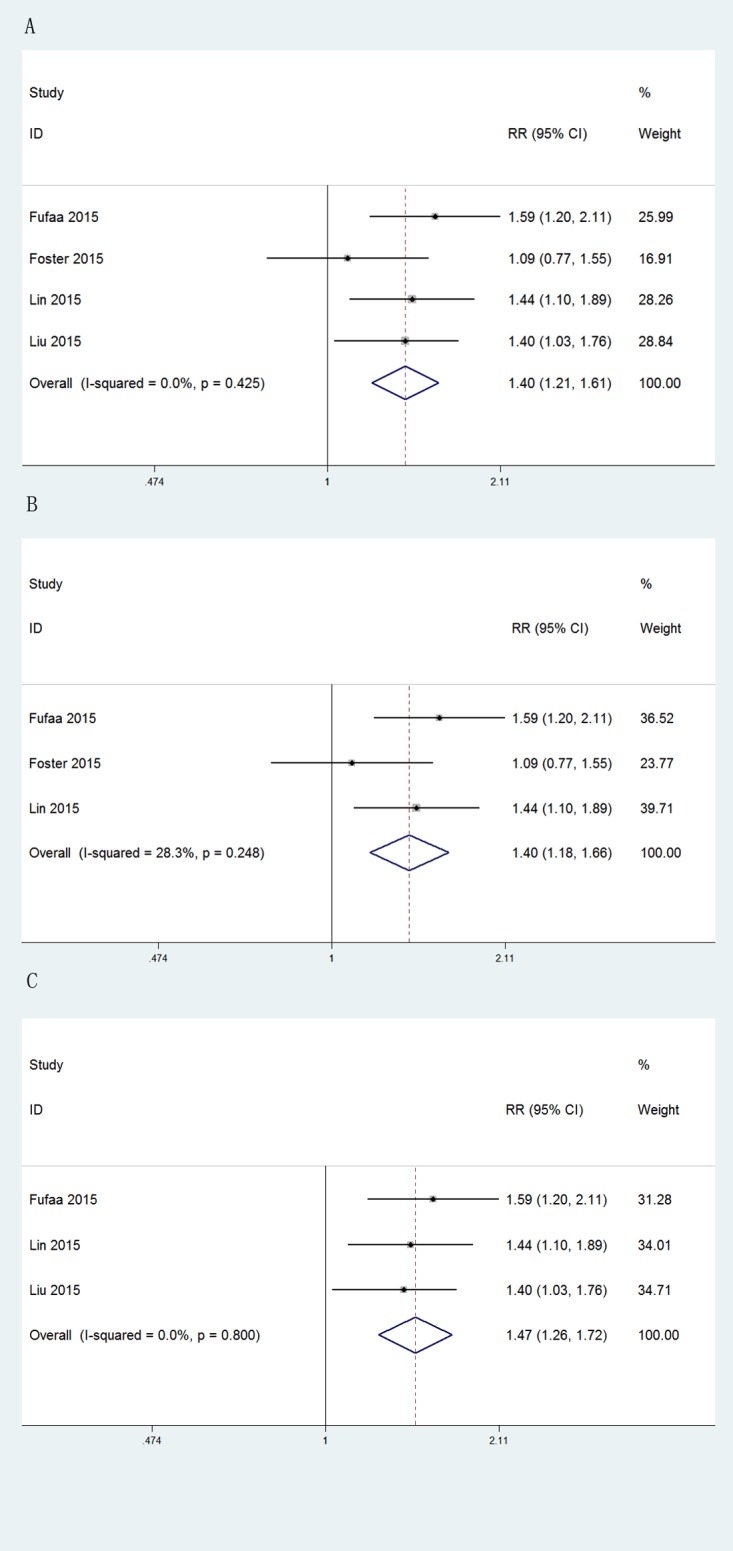
Fig 3. Forest plots of uNGAL in predicting ESRD.

(A) Pooled adjusted risk estimates for ESRD by a 1 SD increase in the log-transformed concentration of uNGAL. (B) Subgroup analysis excluding one study in which uNGAL was reported without Cr-adjustment. (C) Subgroup analysis excluding one community-based study.
