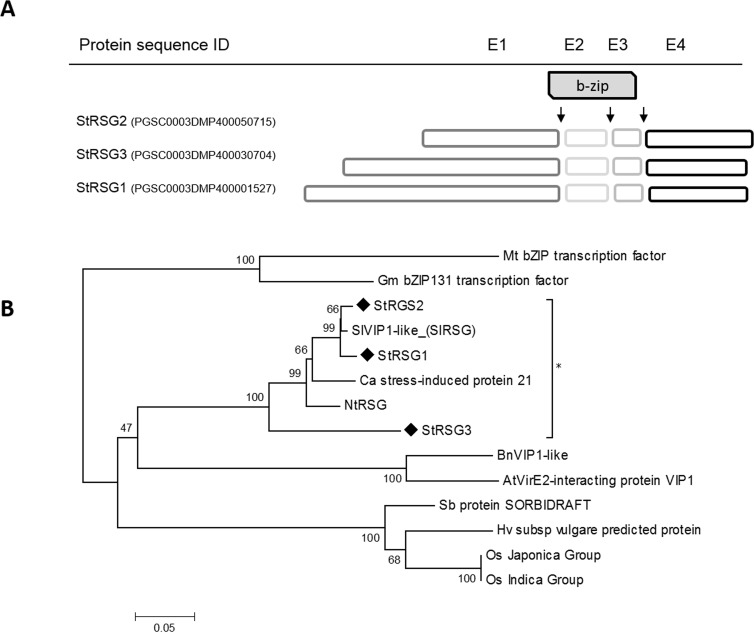
Fig 1. Structure and phylogenetic analysis of RSG proteins.
(A) Schematic model of StRSG proteins indicating the region spanned by each exon (E1-4: exons 1–4.); arrows indicate intron positions. The grey box indicates the bZIP domain. Exons lengths are scaled. Intron lengths are indicated in S2 Table. (B) Evolutionary relationships of RSGs full amino acid sequences from S. tuberosum StRSG1 (HQ335343.1; PGSC0003DMP400001527), StRSG2 (PGSC0003DMP400050715), and StRSG3 (PGSC0003DMP400030704), Solanum lycopersicum SlVIP1-like (XP_004237777.1), Nicotiana tabacum NtRSG (BAA97100.1), Capsicum annuum stress-induced protein 21 (AHI85726.1), Arabidopsis thaliana VirE2-interacting protein VIP1 (AAM63070.1), Brassica napus TF VIP1-like (NP_001303096.1), Glycine max bZIP TF bZIP131 (NP_001237194.1), Medicago truncatula bZIP (XP_013451804.1), Oryza sativa Os_12g0162500 Japonica Group, a hypothetical protein (OsI_37568) belonging to Indica Group, Hordeum vulgare predicted protein (BAK03813.1), and Sorghum bicolor hypothetical protein SORBIDRAFT (XP_002441871.1). Amino acid sequences were aligned using ClustalW. The evolutionary history was inferred using the Neighbor-Joining method. The tree was constructed after a bootstrap test (n = 500), the percentage of replicate trees are shown next to the branches. The evolutionary distances were computed using the JTT matrix-based method and are in the units of the number of amino acid substitutions per site. Evolutionary analyses were conducted with MEGA6.

