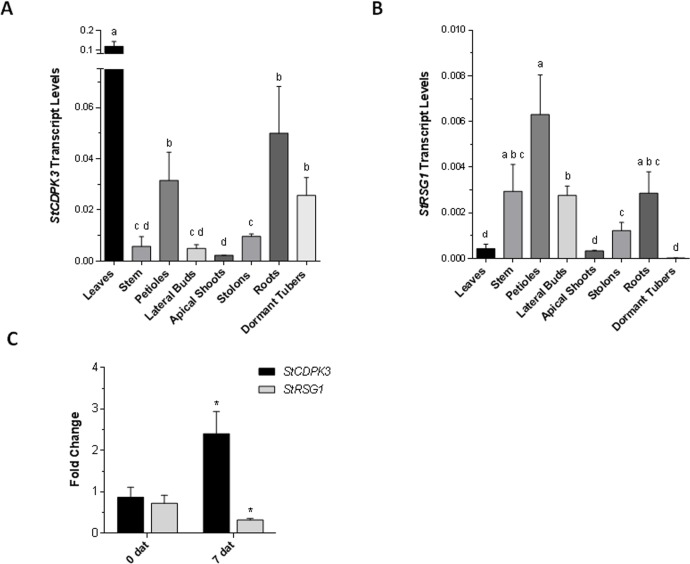
Fig 3. qRT-PCR analysis of StRSG1 and StCDPK3.
Expression analysis of StCDPK3 (A) and StRSG1 (B) in different plants tissues. Transcript levels were normalized using Elongation factor-1 α (EF-1α). Means ± SEM of three biological replicates each with three technical replicates were plotted. One-way ANOVA analysis was performed, and Tukey's HSD test was applied. Different letters (a-d) above the bars indicate significant differences in transcript levels between tissues (p<0.05). (C) Analysis of StCDPK3 and StRSG1 transcript levels in tubers treated with 5 mg/L GA. Controls were incubated with water; days after treatment (dat) are indicated. EF-1α was used for normalization. Means ± SEM of three biological replicates each, with three technical replicates were plotted. The significance of the fold-change in gene expression between the two time points (0 and 7 dat) was evaluated with Student t-test, (*) p<0.05.

