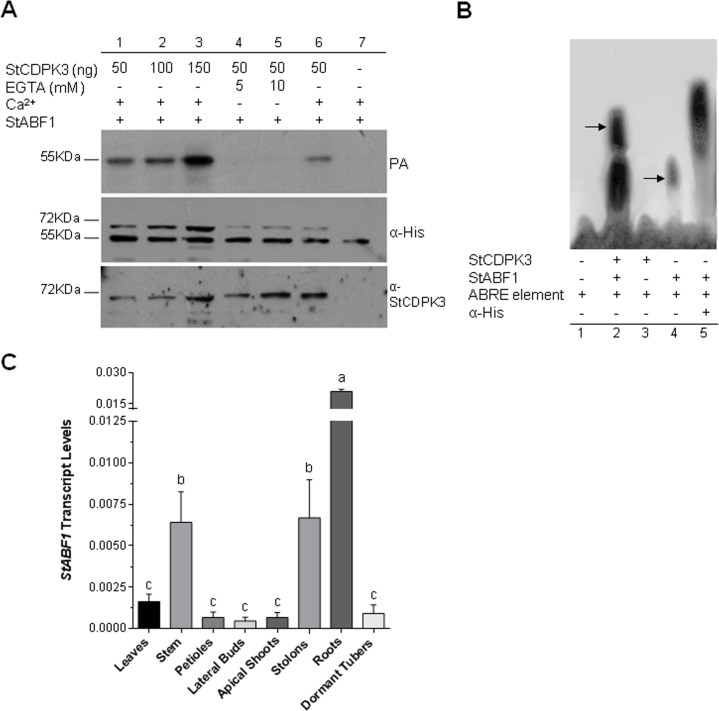
Fig 4. StABF1 is phosphorylated by StCDPK3 and interacts with it.
(A) StABF1 phosphorylation assay (PA) was performed using 6xHisStCDPK3 as enzyme source (ng used are indicated in each lane), 6xHisStABF1 (0.5 μg) as phosphate acceptor, and ATPγP32 as phosphate donor. Assays were conducted in the presence of 20 μM Ca2+ (lanes 1, 2, 3, 6 and 7) or EGTA (lanes 4 and 5). Middle and lower panels: western blot with anti-His (1:5000) and anti-StCDPK3 (NTV, 1:1000) antibodies, respectively. (B) EMSA. The ABRE element was used as a radiolabeled probe. 6xHisStABF1 (1 μg) or 6xHisStCDPK3 (125 ng) were added when indicated. Lane 1: probe alone, lane 2: probe + StABF1 + StCDPK3, lane 3: probe + StCDPK3, lane 4: probe + StABF1, lane 5: probe + StABF1 + anti-His antibody. Shift and super-shift bands are indicated by arrows. (C) qRT-PCR analysis of StABF1 in different plants tissues. Transcript levels were normalized using EF-1α. Means ± SEM of three biological replicates each with three technical replicates were plotted. One-way ANOVA analysis was performed and Tukey's HSD test was applied. Different letters (a-c) above the bars indicate significant differences in transcript levels between tissues (p<0.05).

