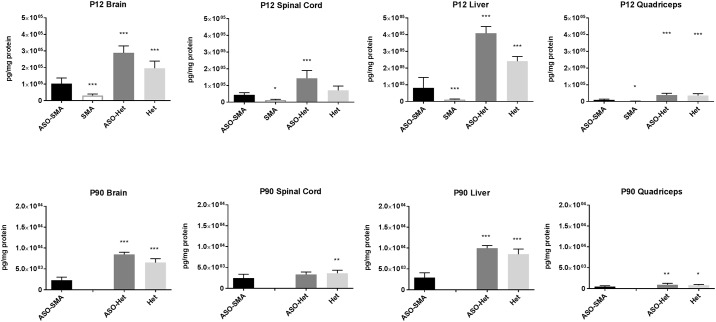
Fig 1. SMN levels in brain, spinal cord, liver and quadriceps muscle at P12 and P90.
SMN levels were compared between ASO-treated SMA mice and untreated SMA, ASO-treated Het mice, and untreated Het mice. At P12, SMN levels were increased in ASO-SMA mice (n = 12) in all tissues compared with SMA mice (n = 13). SMN levels were decreased in ASO-SMA mice compared with ASO-Het (n = 10) and Het (n = 5) for all tissues except for spinal cord for which there was not significant difference between ASO-SMA and Het. At P90, SMN levels in ASO-SMA (n = 12) were diminished in all tissues compared with ASO-Het (n = 7) and Het (n = 8) animals except spinal cord for which there was no significant difference between ASO-SMA and controls. (Note the different scale for P12 versus P90 SMN levels).

