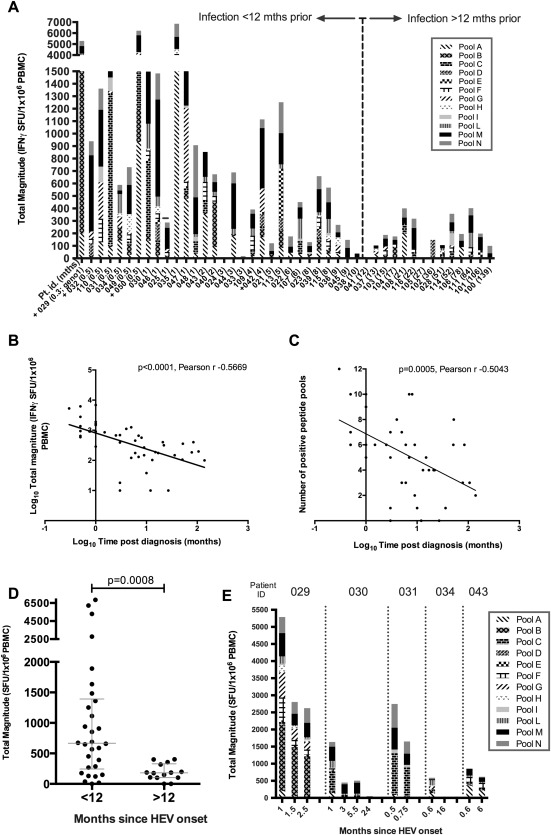
Figure 2.

Total magnitude of HEV specific T‐cell responses in immune‐competent HEV‐exposed subjects measured by IFN‐γ ELISpot assay. (A) IFN‐ γ ELISpot responses displayed according to time interval (<12 months or >12 months) between diagnosis and assessment of T‐cell responses. x‐axis: individual subject number; the number in brackets represents the time interval (in months). Individuals who had detectable virus (PCR) at the time of the assay are indicated with a + on the x‐axis label, and the 1 patient infected with genotype 1 HEV (029) is labeled “geno1.” y‐axis: Each column represents the summed IFN‐γ ELISpot response to HEV peptide pools (A‐I, L‐N) for an individual patient. Individual shading patterns within bars indicate the contributing response of each peptide pool (see legend). (B) Pearson's correlation analysis of total magnitude of IFN‐γ ELISpot response (y‐axis; log10 scale) with increasing time from diagnosis in months (x‐axis; log10 scale). Linear regression line has been plotted. (C) Pearson's correlation analysis for number of positive peptide pools (y‐axis; linear scale) with increasing time from diagnosis in months (x‐axis; log10 scale). Linear regression line has been plotted. (D) Summed IFN‐γ ELISpot responses in individuals grouped according to an interval of either <12 months or >12 months between HEV infection and assessment. Horizontal lines represent group medians (±interquartile range). (E) Longitudinal IFN‐γ ELISpot responses, plotted as total magnitude (y‐axis) assessed over time (indicated on x‐axis) in 5 individual volunteers after onset of acute HEV infection.
