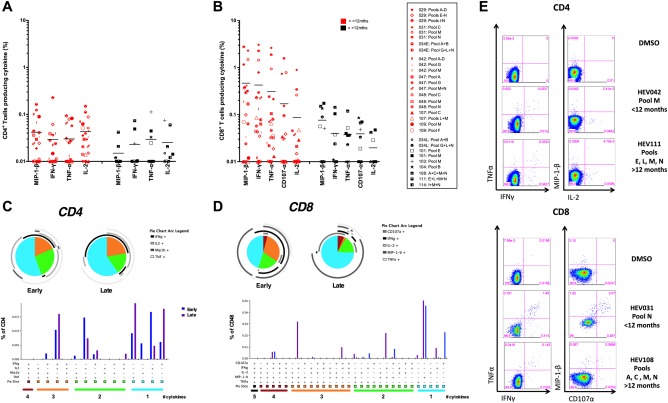
Figure 5.

Functionality of T‐cell responses following HEV peptide stimulation (A,B); percentages of CD4+ (A) or CD8+ (B) T cells producing a given cytokine (background subtracted). Each symbol represents a patient's response to PBMC stimulation overnight (16 hours) with a peptide pool or pools assessed by intracellular cytokine staining. Fourteen immunocompetent HEV‐exposed individuals were assessed (for subject IDs, see legend). Symbols in red are subjects with an interval between diagnosis and collection of PBMCs of <12 months (n = 21); those in black are >12 months (n = 9). Horizontal lines represent group means. (C,D) Polyfunctionality of T‐cell responses to HEV peptide pool stimulation. SPICE analysis was performed on positive CD8+ and CD4+ T‐cell responses from 14 immunocompetent HEV‐exposed volunteers (responses >0.03% of CD4+ or CD8+ T cells producing any single cytokine assessed were considered positive) measured at an early time point (<12 months) or a late time point postdiagnosis (>12 months). Pie charts represent the proportion of cytokine‐secreting cells that produce one, two, three, and four cytokines (IFN‐γ, TNF‐α, MIP‐1‐β, and/or IL‐2) for CD4+ T cells and up to five cytokines (CD107α) for CD8+ T cells. Pie arcs show the proportion of T cells producing a single cytokine. Bar and pie base, median. (E) Example ICS FACS plots: staining for TNF‐α versus IFN‐γ and MIP‐1‐β versus IL‐2 for CD4+ T cells and TNF‐α versus IFN‐γ and MIP‐1‐β versus CD107α for CD8+ T cells after stimulation with pooled HEV peptides or DMSO (negative control). Plots are gated on live, CD3+, CD4+, or CD8+ T cells.
