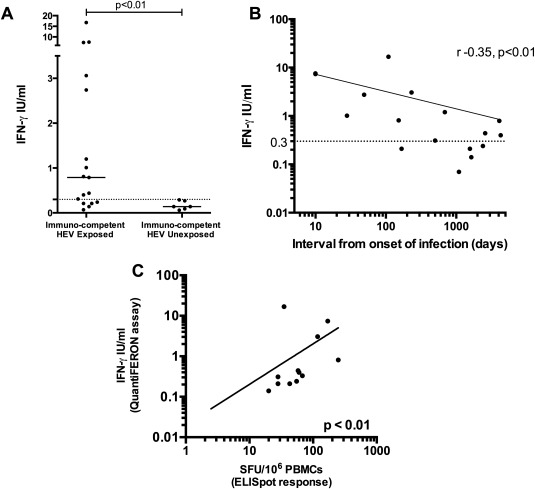
Figure 6.

Quantitative assessment of IFN‐γ production by whole blood in response to HEV antigen 239. (A) Six unexposed healthy volunteers compared to 17 immune‐competent HEV‐exposed individuals. Complete horizontal lines represent group medians; the horizontal dotted line represents an arbitrary cut off of 0.3 IU/mL. (B) IFN‐γ production assessed using the QuantiFERON assay. The x‐axis (log scale) represents the time (days) between clinical onset of HEV infection and sample collection. The y‐axis (log scale) is the plasma IFN‐γ concentration after stimulation of whole blood in vitro with HEV antigen 239. (C) Spearman's correlation analysis between QuantiFERON results (y‐axis; log10 scale) and IFN‐γ ELISpot (x‐axis; log10 scale) response to the peptide pool (pool N) corresponding to HEV antigen 239. Lines of best fit are demonstrated on graphs (B) and (C).
