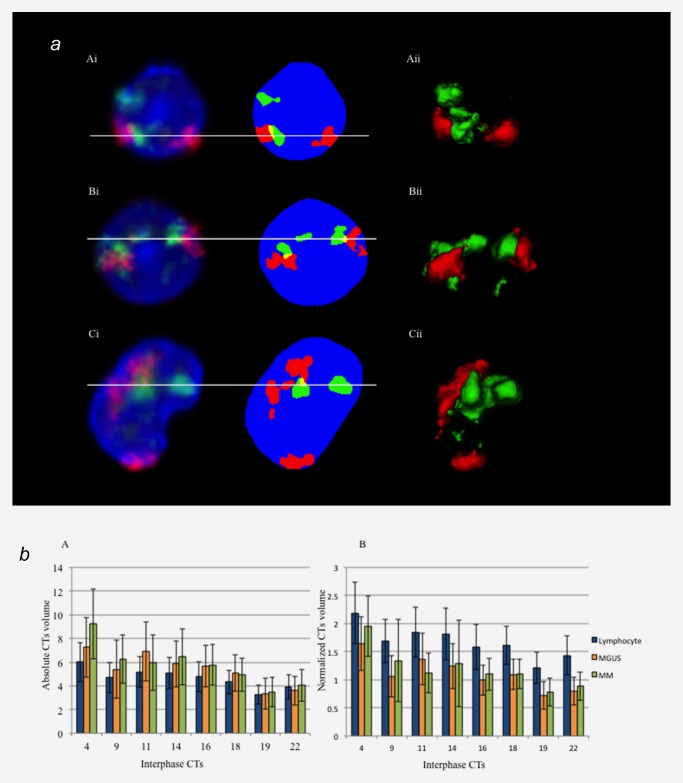
Figure 1.

(a) Representative screenshot of chromosome segmentation and 3D reconstruction data of chromosome 4 and 14 territories in control lymphocyte (A), MGUS (B) and MM nuclei (C). Left panel (Ai, Bi and Ci) represents the 2D and pre‐segmentation image. Right panel (Aii, Bii and Cii) represents 3D reconstruction of each nucleus (DAPI is not shown in 3D‐image). Nuclei are counterstained with DAPI (blue), chromosome 4 territories are in red (Cyanine 3) and chromosome 14 territories are in green (FITC). Conventional 3D epifluorescence microscopy was used. Note the overlapping regions within CTs are shown in yellow. (b) Mean nuclear and CTs volume measurements in lymphocytes (blue), MGUS (orange) and MM nuclei (green). The error bar represents one standard error of the mean. The absolute CT volumes in myeloma nuclei are larger than in control lymphocytes but the normalized CTs volumes are largest in lymphocyte nuclei, and then followed by MM and MGUS nuclei.
