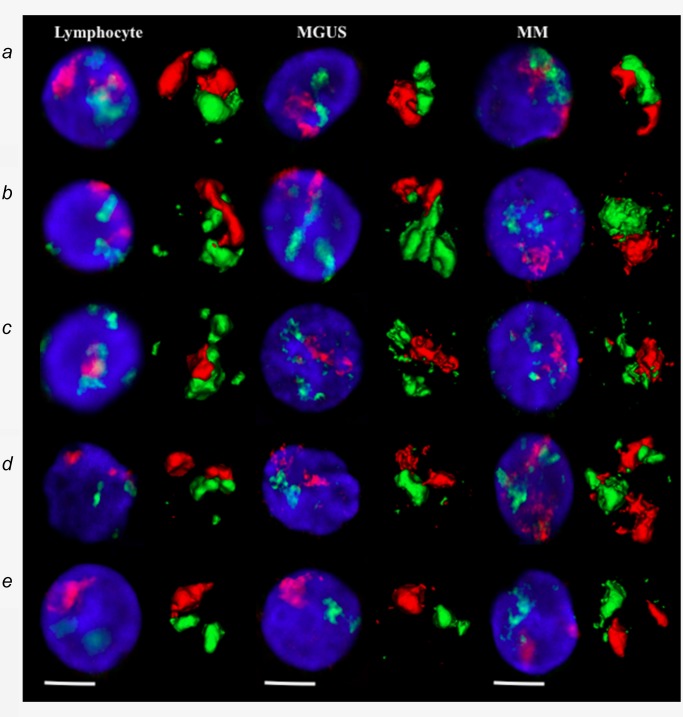
Figure 2.

(a) Representative data of chromosome positions in interphase nuclei of lymphocytes, MGUS and MM after conventional 3D epifluorescence microscopy. Visualization of the 2D image and 3D reconstruction of specific CTs after 3D‐FISH using human whole chromosome painting probes on lymphocytes (left), MGUS cells (middle) and MM cells (right panel). (A) chromosome 4 (red) and 14 (green); (B) chromosome 11 (red) and 14 (green); (C) chromosome 14 (green) and 16 (red); (D) chromosome 9 (red) and 22 (green); and (E) chromosome 18 (red) and 19 (green). DNA counterstain is shown in blue (scale bar = 7 μm).
