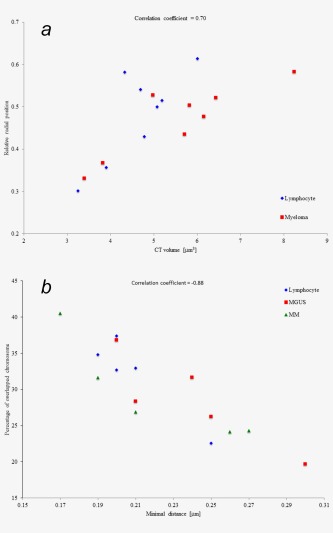
Figure 3.

(a) Relationship between the size of CTs and their relative radial position within the nucleus of lymphocytes and myeloma. Blue data points represent lymphocytes and red data points represent myeloma cell. Each data point is the average for a patient. Position measurements are taken from CTs to the center of the nuclei and then normalized by dividing by the radius of the nucleus. The scatterplot shows a correlation between the size of CTs and their radial position within the nucleus (correlation coefficient = 0.70). Large chromosomes are located more distal to the nuclear center (larger relative radial position) than smaller chromosomes. (b) Relationship between the percentage of overlapping CTs and their minimal mutual distance in lymphocytes, MGUS and MM. These two measures correlate (correlation coefficient = −0.88). When chromosomes are located closer together they overlap more. Each data point represents the averages for a patient.
