
Figure 2.
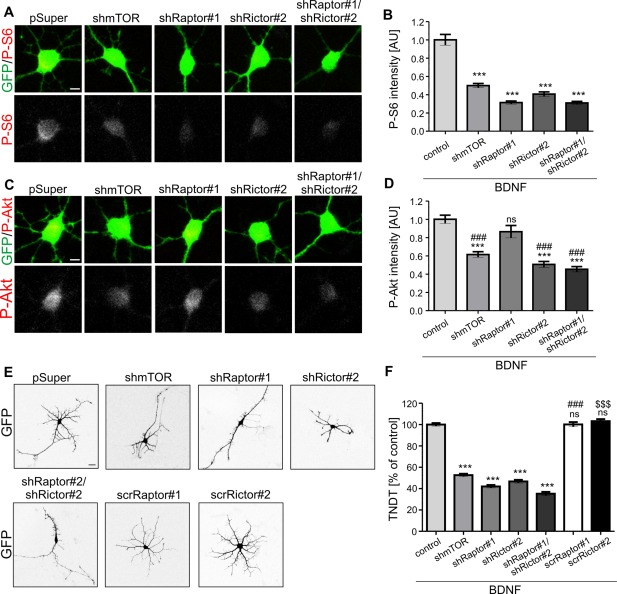
Proper dendritic arborization of SVZ‐derived neurons cultured in vitro requires both mTORC1 and mTORC2. (A) Representative confocal images of SVZ‐derived neurons transfected as indicated and immunofluorescently stained for ribosomal protein S6 phosphorylated at Ser235/236 (P‐S6) and GFP. Scale bar = 5 µm. Neural progenitors were isolated from the SVZ, dissociated, and plated in differentiation‐promoting conditions. On day 1, the cells were transfected with pSUPER (control), pSUPER‐mTOR7513 (shmTOR), pSUPER‐shRaptor#1 (shRaptor#1), pSUPER‐shRictor#2 (shRictor#2) or pSUPER‐shRaptor#1 and pSUPER‐shRictor#2 (shRaptor#1/shRictor#2). A GFP‐encoding plasmid was co‐transfected in all of the variants to visualize neuron morphology. Brain‐derived neurotrophic factor (BDNF) was added 24 h postransfection. Cells were fixed 4 days after plating. (B) Quantitative analysis of average intensity of P‐S6 immunofluorescence of neurons transfected and treated as in A. Number of experiments (N) = 2. Number of analyzed cells (n) = 59 (pSUPER, control), 37 (shmTOR), 44 (shRaptor#1), 38 (shRictor#2), 44 (shRaptor#1/shRictor#2). The data are expressed as mean values normalized to the control. Error bars indicate SEM. ***p < 0.001; ns, not significant vs. control (Kruskal–Wallis test with Dunn's post hoc test). AU, arbitrary units. (C) Representative confocal images of SVZ‐derived neurons transfected and treated as in A and stained for Akt phosphorylated at Ser473 (P‐Akt) and GFP. Scale bar = 5 µm. Progenitors were isolated from the SVZ, dissociated, and plated in differentiation‐promoting conditions with brain‐derived neurotrophic factor (BDNF). On day 1 cells were transfected as in A. (D) Quantitative analysis of average intensity of P‐Akt immunofluorescence of neurons treated as in A. Number of experiments (N) = 2. Number of analyzed cells (n) = 31 (pSUPER, control), 28 (shmTOR), 31 (shRaptor#1), 35 (shRictor#2), 31 (shRaptor#1/shRictor#2). The data are expressed as mean values normalized to the control. Error bars indicate SEM. ***p < 0.001; ns, not significant vs. control; ### p < 0.001 vs. shRaptor#1 (Kruskal–Wallis test with Dunn's post hoc test). AU, arbitrary units. (E) Representative confocal images of SVZ‐derived neurons transfected as indicated and immunofluorescently stained for GFP. Scale bar = 20 µm. Progenitors were isolated from the SVZ, dissociated, and plated in differentiation‐promoting conditions. On day 1, the cells were transfected with pSUPER (control), pSUPER‐mTOR7513 (shmTOR), pSUPER‐shRaptor#1 (shRaptor#1), pSUPER‐shRictor#2 (shRictor#2), pSUPER‐shRaptor#1 and pSUPER‐shRictor#2 (shRaptor#1/shRictor#2), pSUPER‐scrRaptor#1 (scrRaptor#1) or pSUPER‐scrRictor#2 (scrRictor#2). A GFP‐encoding plasmid was co‐transfected in all of the variants to visualize neuron morphology. BDNF was added 24 h postransfection. Cells were fixed 4 days after plating. (F) Quantitative analysis of the number of dendrites of neurons transfected and treated as in E. The bar graph shows the analysis of the number of dendritic tips as a percentage of the value normalized to the control in a given experiment. Error bars indicate SEM. Number of experiments (N) = 3. Number of analyzed cells (n) = 34 (pSUPER), 52 (shmTOR), 48 (shRaptor#1), 57 (shRictor#2), 56 (shRaptor#1; shRictor#2), 30 (scrRaptor#1), 30 (scrRictor#2). ***p < 0.001, ns ‐ not significant vs. control, ### p < 0.001 vs. shRaptor#1, $$$ p < 0.001 vs. shRictor#2 (Kruskal–Wallis test with Dunn's post hoc test).